
Proflex Market Update — Week July 20–24, 2026
FOMC Uncertainty | 34% of the S&P Reports | AI Doubts Return | The Semis Selloff Decoded
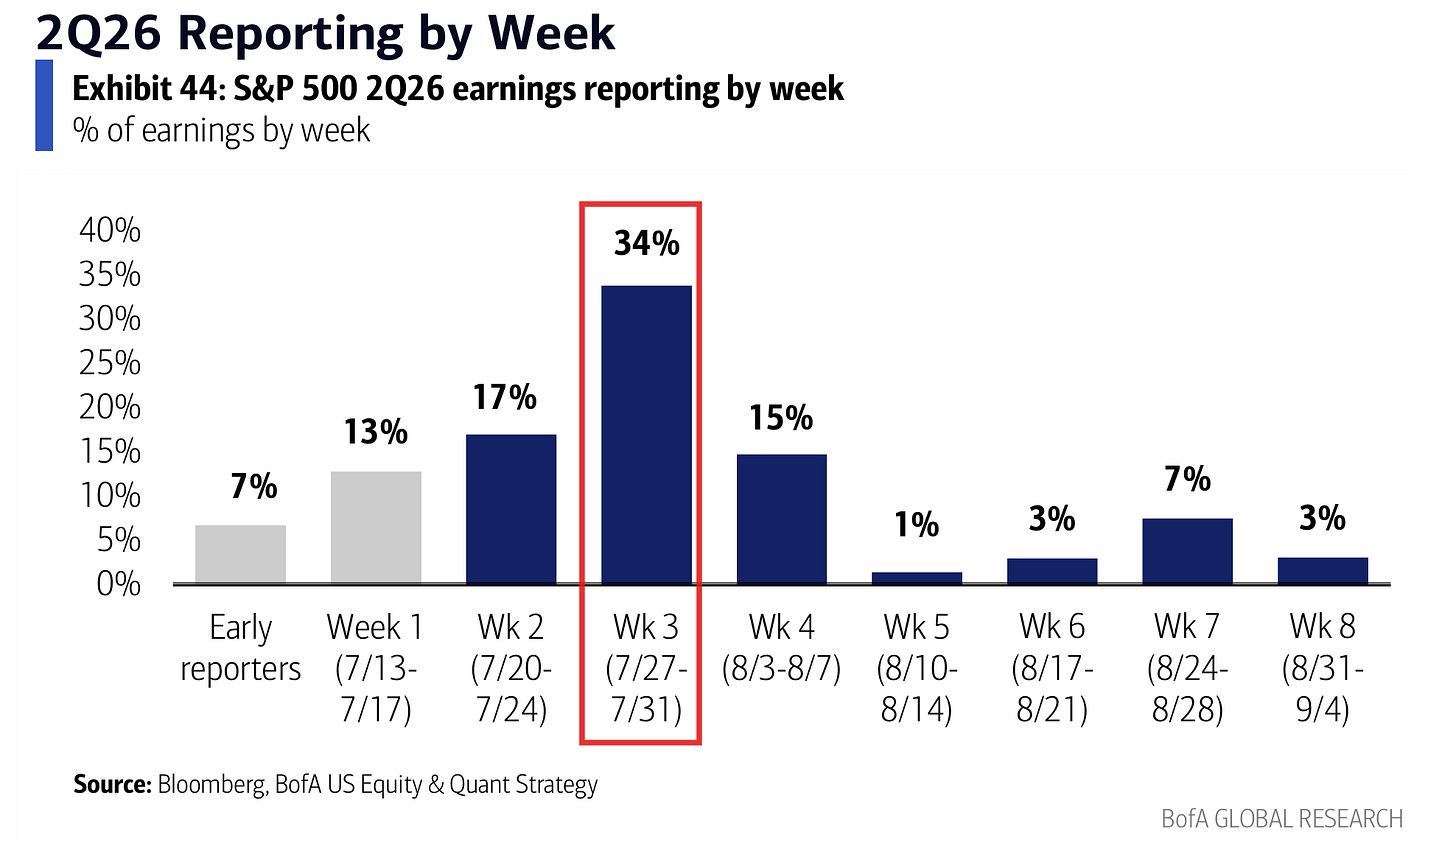
The upcoming week is headlined by the FOMC Meet & the heaviest earnings week of the season with 34% of the S&P 500 reporting by earnings weight, and the dual Thursday release of second quarter GDP alongside June personal income and spending.
Semiconductors have fallen 20% from their June 22 peak into a technical bear market, erasing $3.3 trillion of value, while the fundamentals of that exact sector accelerated through the same window.
 The AI trade is showing genuine earnings progression. The doubts have come back anyway.
|
That repricing happened in one week, and the trigger was crude pushing above $100 mid month. Chair Warsh has been consistent: prices are still too high, and the June dot plot showed 9 of 19 policymakers penciling at least one hike by year end with six penciling two.
There is no Summary of Economic Projections at this meeting, so the statement language and the 2:30pm press conference carry the entire signal.
The awkward part is the data the Fed is staring at.
June payrolls printed +57,000 against a 113,000 consensus with unemployment at 4.2%, yet initial claims last week came in at 187,000, the lowest since 1969.
The labor market is reading as simultaneously the weakest and the tightest in decades, and PCE prices are still expected near 3.7% headline and 3.3% core when they land Thursday.
The Data and the Supply Both Land in the Same 72 Hours
The headline is Thursday: second quarter GDP releases alongside the separately published June personal income and spending report, and both carry PCE price readings.
PCE remains the traditional preferred inflation gauge, though it looks to be de emphasized under this Fed.
The Atlanta Fed GDPNow tracker sits at 1.7% as of July 17, revised up from 1.2% at the start of the month.
 |
Treasury supply lands into the same window on a compressed timetable, because the auctions have to dodge both the Fed meeting and month end:
- $70bn 5 year Monday July 27
- $44bn 7 year Tuesday July 28
- $69bn 2 year Wednesday July 29
That is $183bn of coupon supply hitting a market where the 10 year has already backed up 16bp in ten days and the long bond is above 5%.
The Biggest Earnings Week of the Season
This is the heaviest week of the season: 34% of the S&P 500 by earnings weight, roughly 175 index components, including four Magnificent Seven names and 29 others above $100bn in market cap.
 |
- Microsoft and Meta: Wednesday July 29 after the close. Meta consensus is around $7.13 to $7.23 EPS on roughly $60.2bn of revenue
- Amazon and Apple: Thursday July 30. AMZN consensus $1.81, AAPL $1.88
- Then BRK (Saturday), V, XOM, MA, ABBV, LRCX, CVX, KO, PG, KLAC, LIN, STX, APH, QCOM, WELL, BA, ETN, GLW, BMY, APD, SYK, MO, SBUX, VRT, FTNT, SO, TT, GD and EQIX in order of earnings weight
- Ex US heavyweights: SK Hynix Wednesday, Samsung Electronics, and ARM
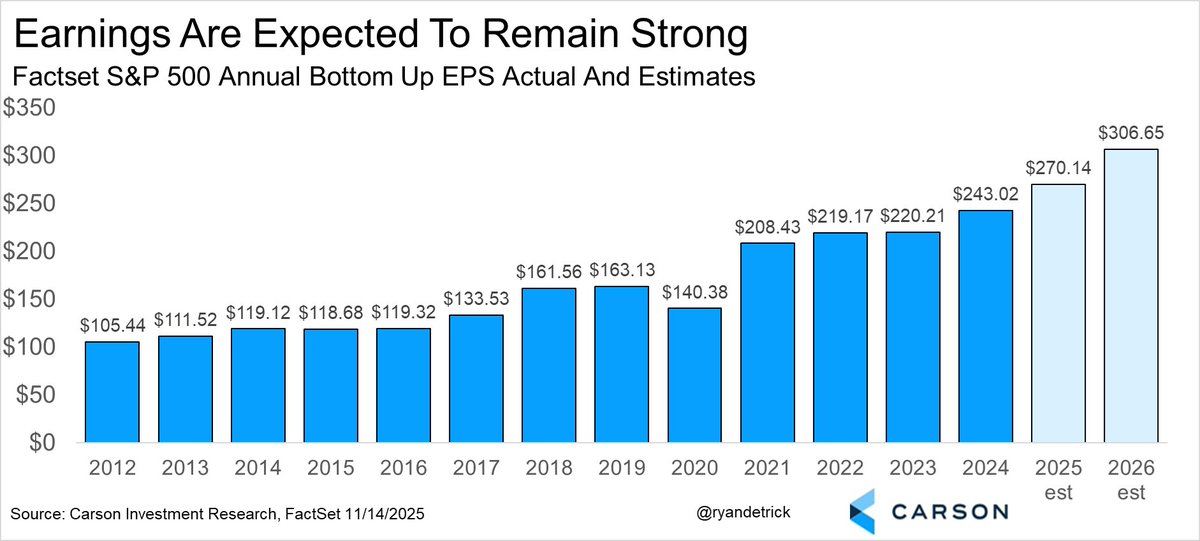
The bar going in is extraordinary. FactSet has Q2 blended earnings growth at 37.9%, or 25.9% excluding Alphabet, which would be the strongest since Q3 2021.
The beat rate is 80% against a 70% five year average, and blended net margin is 15.7%, the highest since FactSet began tracking in 2009.
 |
Alphabet already showed what happens when you clear that bar. Revenue $119.8bn up 24%, cloud revenue up 63% to $20bn, a $514bn backlog. The stock fell, because capex guidance went to a $205bn envelope.
Tesla did the reverse: revenue $28.24bn beat handily, EPS of $0.33 missed the $0.51 estimate, and the stock dropped 14%.
Get This Analysis Every Week
Join 250+ investors at Google, Amazon & Apple who start their week with Proflex.
No spam. Unsubscribe anytime.
AI Doubts Return: The Progression Is Real, the Rotation Is Wrong
The AI trade is showing clear earnings progression and the doubts have come back anyway. Both things are true at once, and separating them is the most valuable work we can do for you this week.
First, the doubts, because some of them are legitimate.
The BofA July Global Fund Manager Survey (210 managers, $555bn AUM) found 48% now name hyperscaler AI capex as the most likely source of a systemic credit event, ranking it above private credit, the Iran conflict, tariffs and recession.
45% call an AI bubble the biggest tail risk, up 17 points from June. The specific complaints:
- Free cash flow is being consumed. Alphabet free cash flow is down roughly 90% to $8.2bn, Microsoft is guided to a 28% decline this year, and Meta is heading toward single digit billions. Citi now models Google, Meta and Amazon at negative free cash flow in both 2027 and 2028 on $801bn of combined 2027 capex
- The funding has shifted to debt. Incremental annual debt financing has gone from 9% of capex in FY24 to 32% over the last twelve months. AI linked bond issuance has topped $250bn year to date heading toward $570bn, and CNBC reported July 24 that Google, Amazon and Meta credit spreads are widening
- The depreciation question. $725bn of 2026 capex produces only about $211bn of depreciation on this year income statements. Moody’s flags $662bn of unrecognized off balance sheet data center leases across five majors, equal to 113% of their combined adjusted debt
- The ROI gap. Hyperscaler AI run rate revenue is roughly $37bn against roughly $190bn of annual AI capex
Those are real. We are not dismissing them.
Now the part the market has got wrong.
Every one of those concerns is about the check writers: hyperscaler balance sheets, depreciation schedules, payback timelines, off balance sheet structures.
But the selling has landed almost entirely on the check receivers: semiconductors and memory, where the revenue is contracted, sold out, and being delivered right now.
The SOX fell 20% from its June 22 peak of 14,655 to 11,950 by July 20. Look at what happened to the fundamentals during that exact drawdown:
- TSMC Q2 (July 16): revenue $40.2bn up 33.7% year on year, net income up 77.4%, gross margin 67.7%, operating margin 60.3%. June revenue up 68%. AI is now 61% of revenue. Eight consecutive quarters of beats, and 6 upward EPS revisions against 0 downward over 90 days
- Industry sales: May global semiconductor sales hit $120.6bn, up 104.1% year on year and the highest monthly figure ever recorded, the 15th consecutive month of sequential growth (SIA). The industry is tracking toward $1 trillion in 2026 against $791.7bn in 2025
- Memory scarcity: DRAM, NAND and HBM supply demand deficits of 4.9%, 4.2% and 5.1%, the widest since 2011. HBM is sold out for 2026. Q3 DRAM contract pricing is guided up 50% to 55% versus Q4 2025
- The receipts arrive this week: SK Hynix is expected to post a record 64.1 trillion won (about $43.7bn) operating profit Wednesday, and Samsung has already flagged roughly 86 trillion won, a 17x to 18x year on year increase
The three triggers were narrative, not numbers.
Proflex Macro Discussion Group
Join our invite-only, expertly moderated WhatsApp group—where macro meets community.
Tap into real-time commentary from Proflex experts on market shifts, policy cycles, and global events—alongside daily discussions from 190+ Silicon Valley CTOs, CEOs, family offices, and seasoned HNIs.
Proflex Exclusive Investor Community- July 1, Meta Compute. Meta announced it would rent out spare AI capacity. Roughly $200bn of semiconductor and cloud value was erased on the inference that the biggest buyer has servers to spare. Meta simultaneously guided 2026 capex to $115bn to $135bn
- July 13, SK Hynix. Guidance of 60.4 trillion won came in about 8% under consensus and produced the worst Seoul session on record, dragging the KOSPI down 9%. The reason was that Hynix is slowing HBM4 output to make more conventional DRAM, because DRAM margins are more than 15 points higher. That is a margin optimization decision, not a demand failure
- July 16 to 17, Broadcom. Q3 AI chip guidance of $16bn against $17.2bn consensus, with no full year raise. Semis had their worst week since April 2025
And the valuation now makes no sense.
Nvidia trades at a forward P/E of 23.2 while its data center franchise grows 92% year on year at 75% non GAAP gross margins. The semiconductor sector median forward multiple is 32.2.
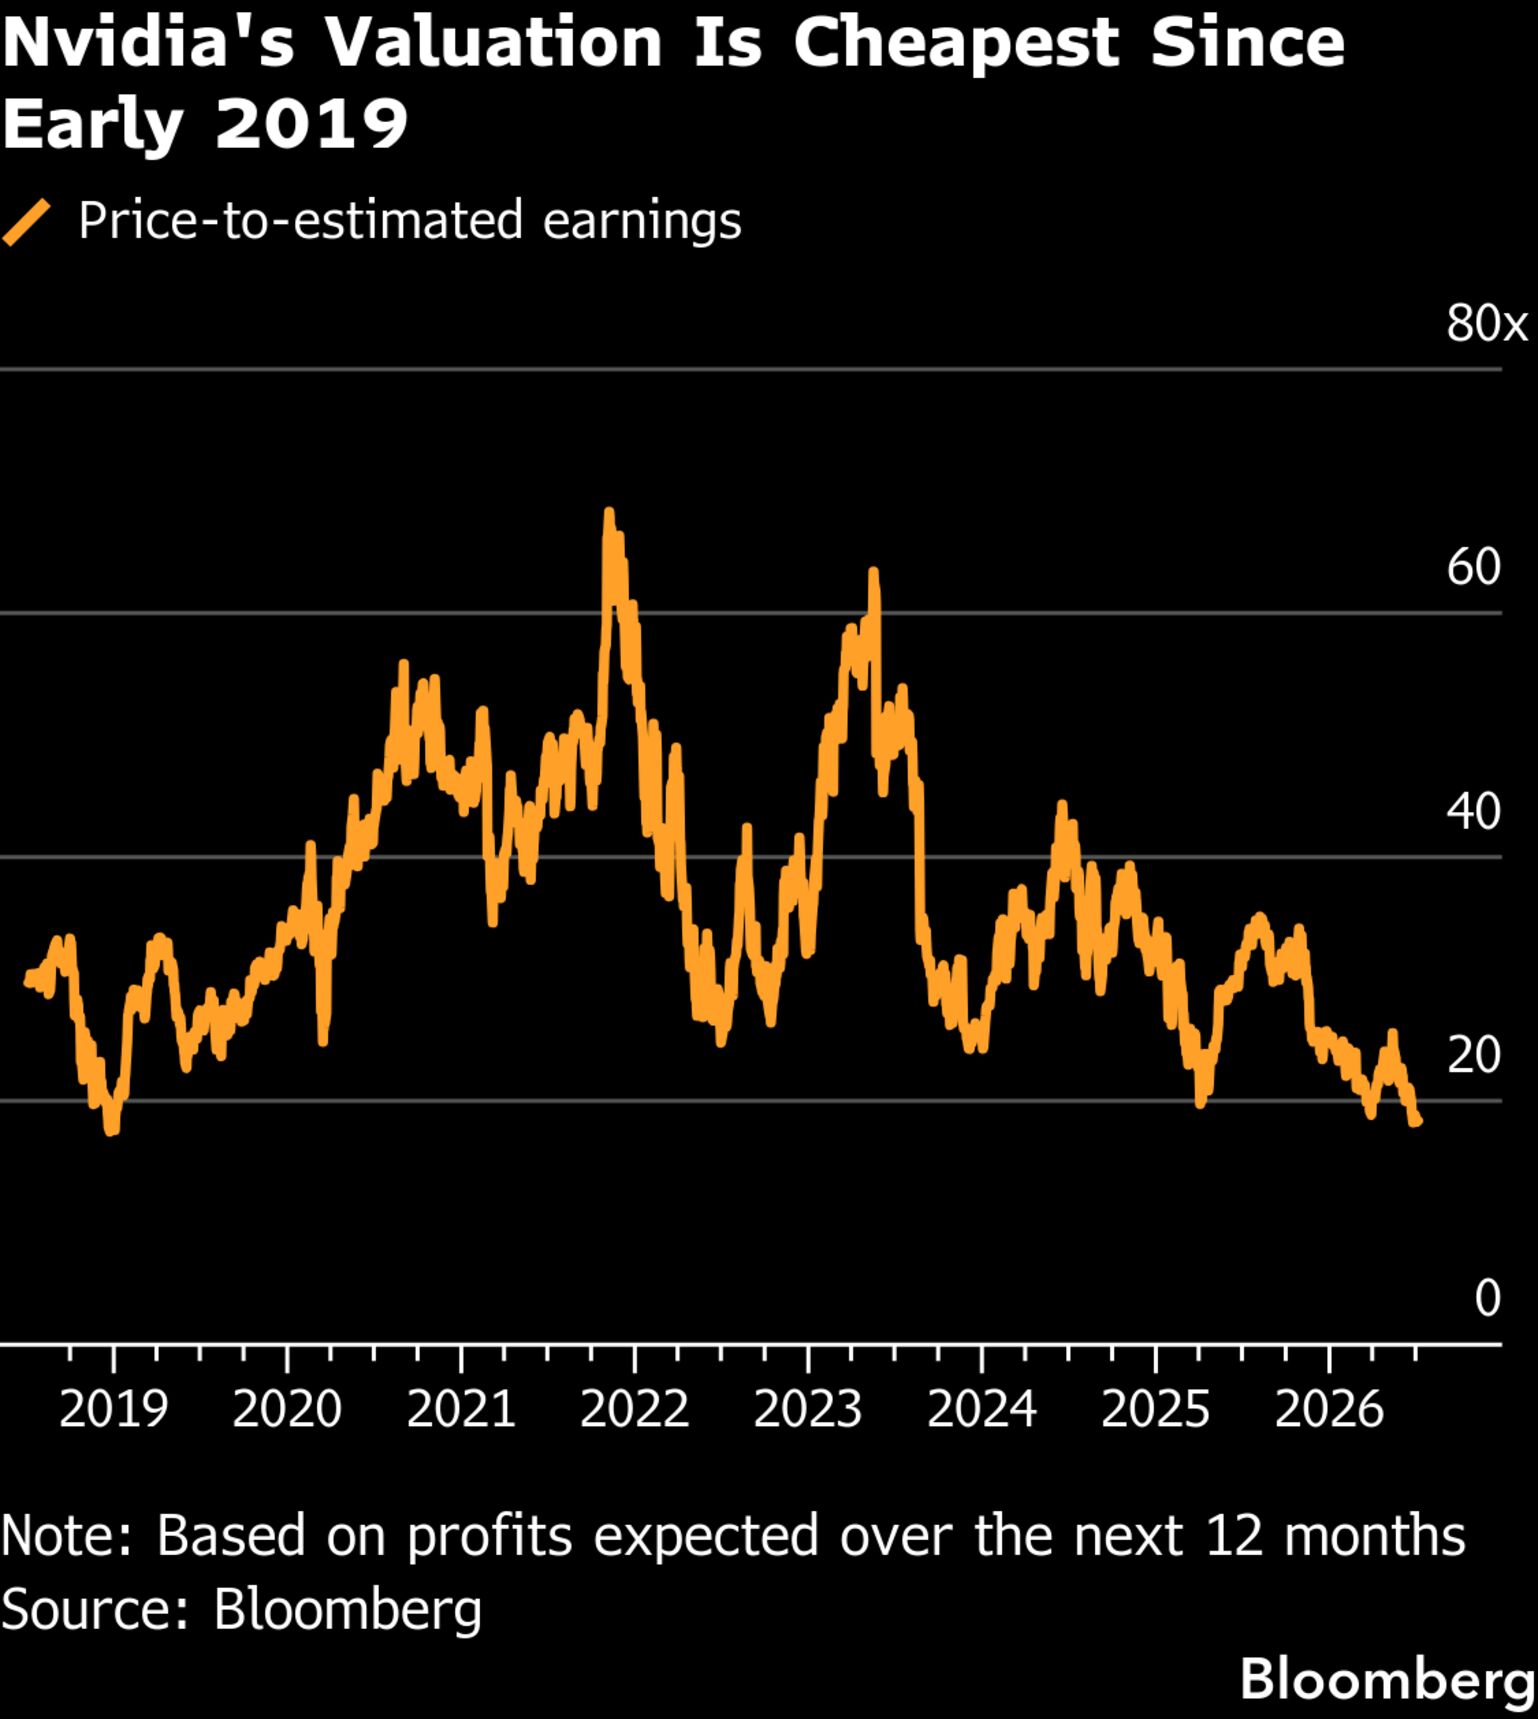 |
The single most feared asset in the market trades at a three point premium to the index while compounding roughly twenty times faster. Micron is at 11.6x forward. Meanwhile Broadcom at 35x and AMD at 73x are where the genuine multiple risk sits, and the sector has not discriminated between them.
Iran: Still Very Fluid
After two weeks of escalation, things de escalated over the weekend and the tape responded immediately.
Brent is back to $90.43 and WTI to $83.60, down 7.6% Monday alone and well off the $100 plus mid month spike.
We do not see any good near term options for President Trump, which makes direction genuinely hard to call.
The prediction markets are the cleanest read, and they have not de escalated with the headlines:
- Kalshi odds of Hormuz traffic normalizing by September 1 peaked at 69% on June 25, collapsed to 7% last week, and sit at 9% today
- Normalisation by year end is at 48%, up from 41% a week ago
- Physical transits ran 16 vessels on July 20 and 10 on July 21 against thousands in a normal month, with 8 vessels struck between July 13 and 20
- War risk insurance is at 7.5% to 10% of hull value, meaning $3m to $10m on a $100m tanker against roughly $250,000 before the crisis
🧭 Proflex Playbook – Buy the Progression, Not the Narrative
The AI trade is delivering earnings progression while the market re litigates the bull case. That gap between what the numbers say and what the tape says is where the opportunity is, provided you are in the right half of the supply chain.
Our conviction stays anchored in the data:
- Focus on Structural Growth: Continue to overweight the secular AI theme, recognizing its multi-year runway.
- Anticipate Shallow Corrections: Use dips as accumulation opportunities, not reasons for fear, understanding that "none of the corrections stick."
- Diversify Thoughtfully: Recognize the "decorrelation" across asset classes; consider gold, silver and Bitcoin for portfolio resilience.
- Develop Mental Models: Prioritize long-term planning (6-12 months out) over short-term news, aiming for consistent, incremental gains.
If you're an All-Access or Managed Portfolio subscriber, our positioning has already shifted ahead of this moment—scaling up asymmetric hard asset plays while hedging for earnings volatility and geopolitical tail risks.
| Proflex All-Access Subscription (Yearly) |
| Proflex All-Access Subscription (Monthly) |
Until next week,
— The Proflex Team
Trusted Macro Insights. Calm Investing. Tactical Trades.
Legal Disclosures