Proflex Oct 19–23 — OpEx Full Circle, Anthropic, Neocloud Scare
Proflex Market Update — Week Oct 19-23, 2026
OpEx Full Circle | Anthropic’s Moving Goalposts | Neoclouds, the MicroStrategy of AI | Earnings Decide It
"Six months ago the market asked whether AI had any revenue. This week it sold off a company growing 45% a quarter for not growing fast enough. Fear is front running the data, just as optimism did in the spring." — Proflex Panel
The week in 30 seconds ▸ The Nasdaq 100 fell 5.5% and gave back everything since the September options expiry. The semis lost 11.4%, their worst week since April 2025. ▸ The equal weight S&P rose 0.5%. This is still rotation inside the market, not money leaving it. ▸ Anthropic grew 45% in a quarter to $16.8 billion and was punished for slowing. GPU rents and memory prices kept rising. ▸ The debt funded AI builders fell 25%. The VIX touched 22.3 on expiry day. In each 2026 spike above 20, the Nasdaq was higher 10 days later. ▸ Nothing is settled until big tech reports. Microsoft and the Fed both land on October 28.
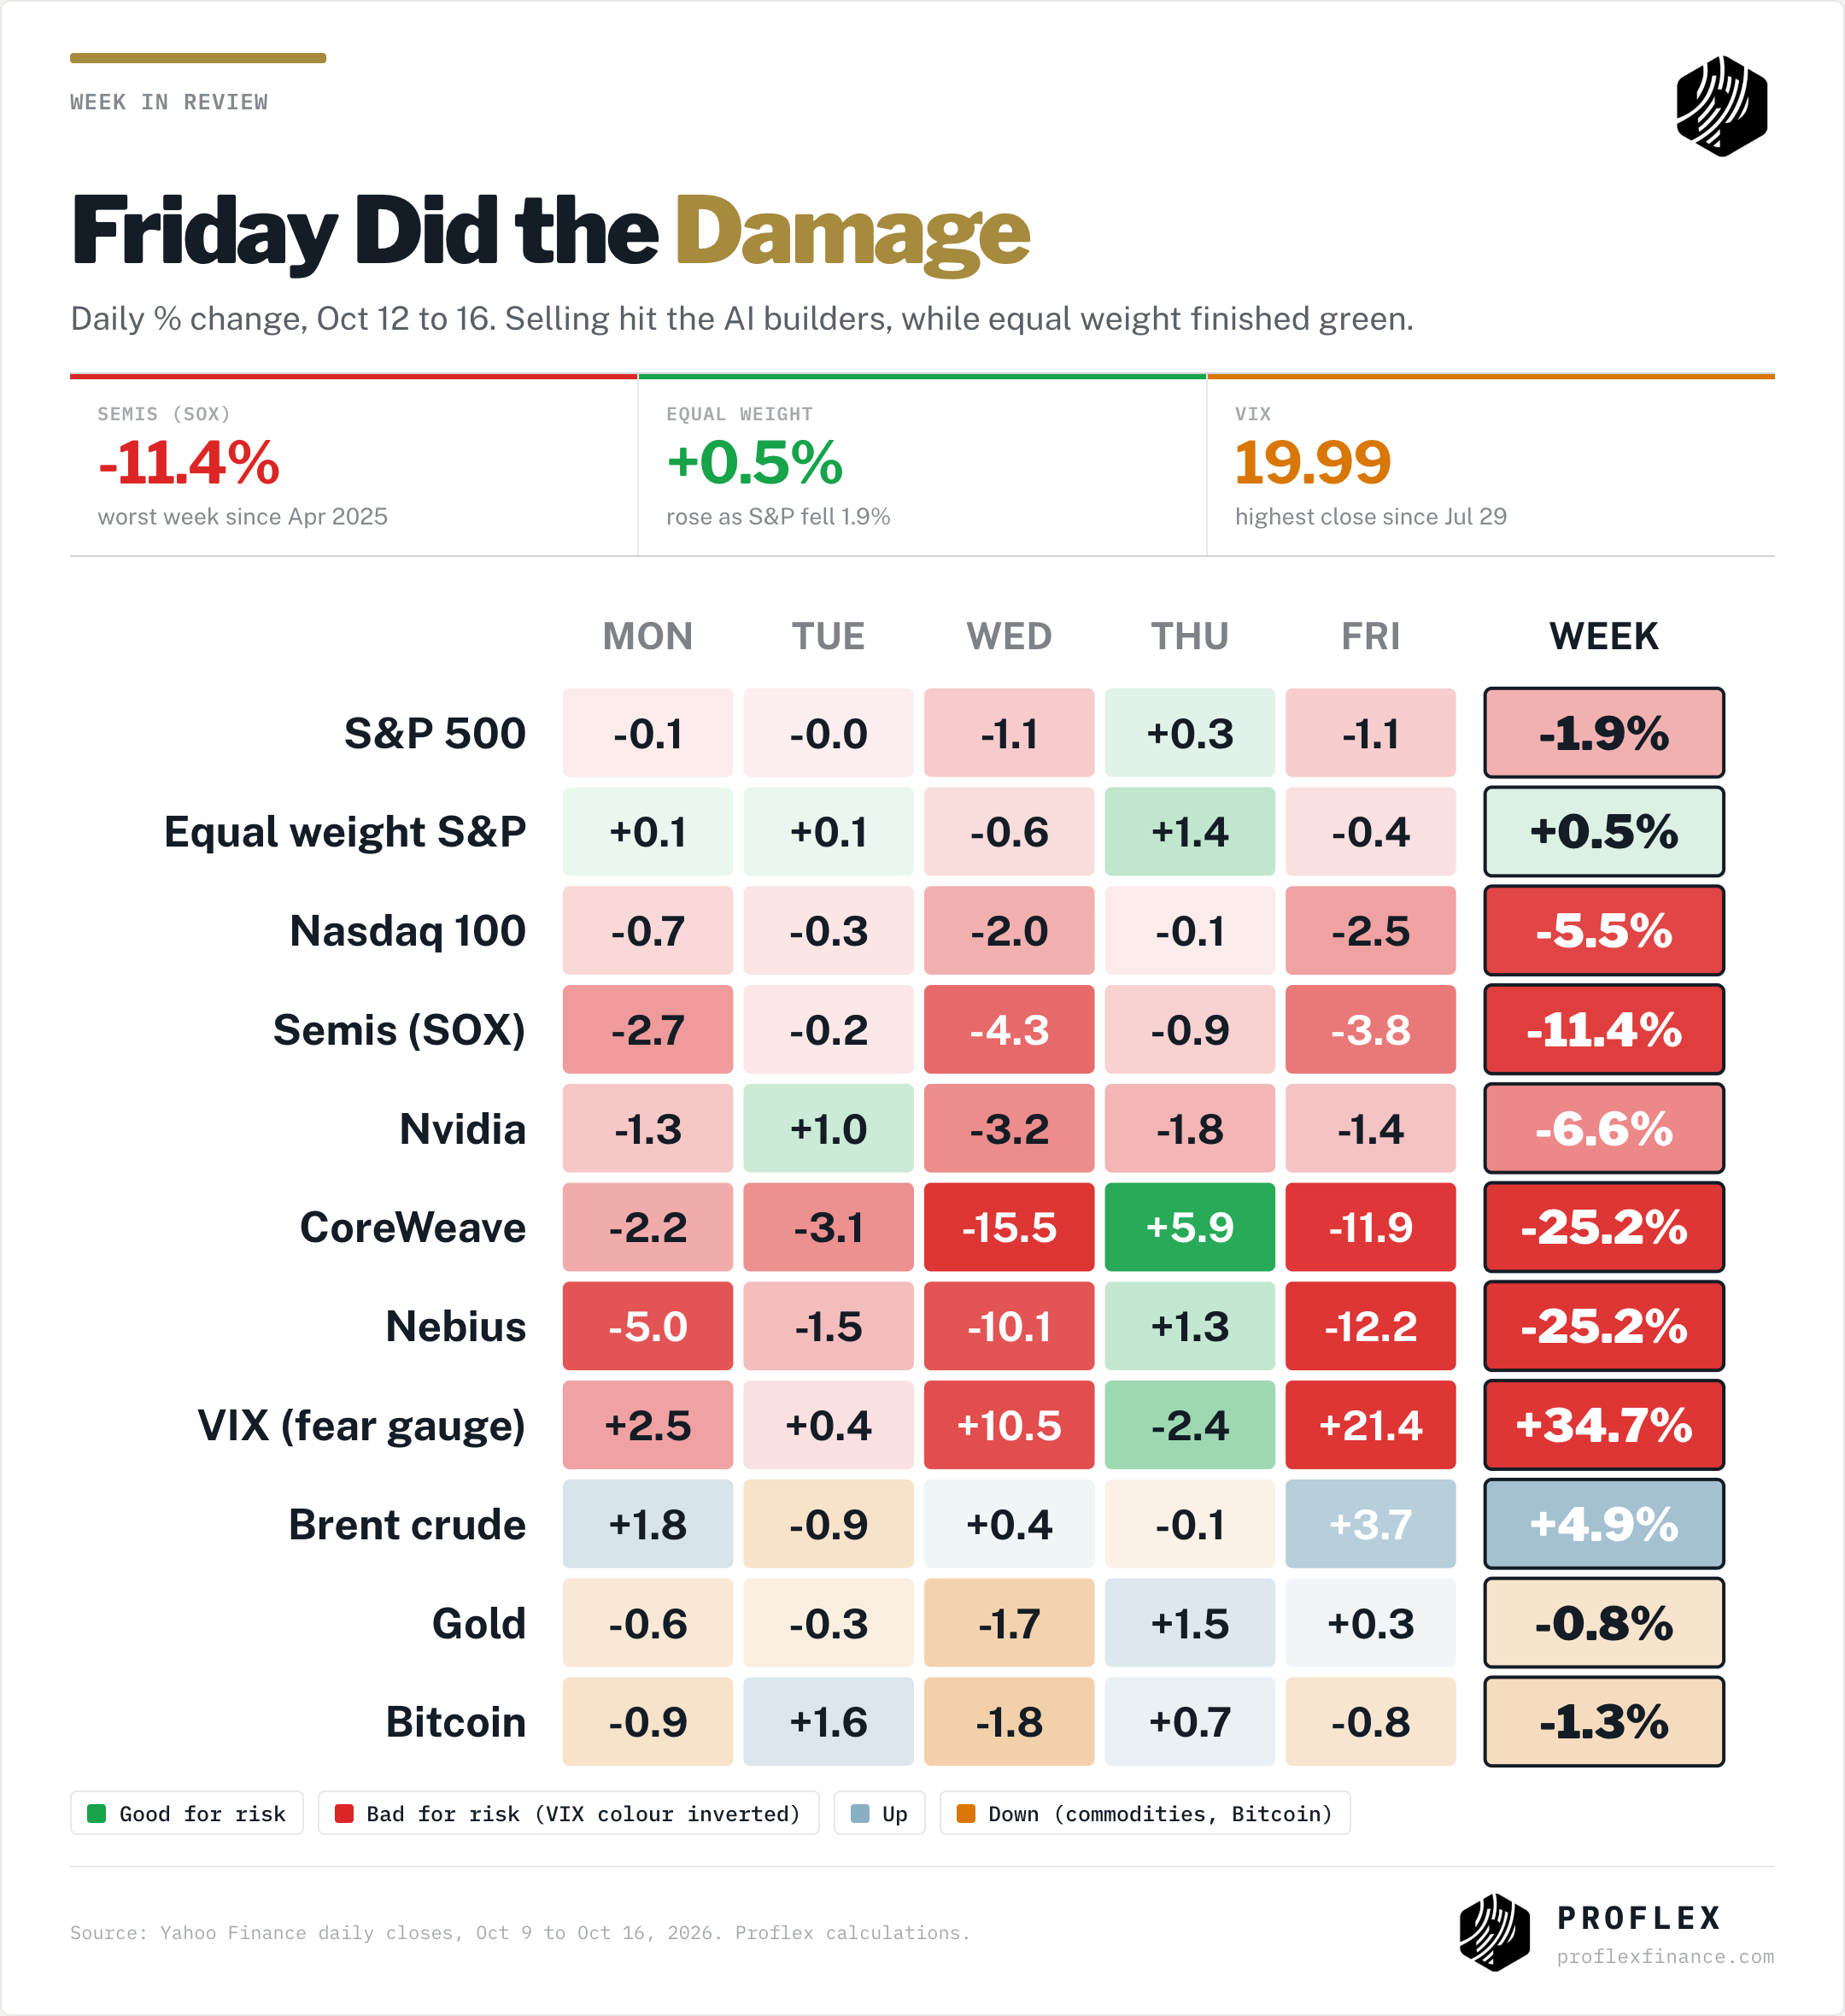
The S&P 500 started last week a fraction below its record. By Friday it had fallen 1.9% to 7,659, the Nasdaq 100 had dropped 5.5% to 29,188, and the semiconductor index had lost 11.4%. Friday did the most damage: the monthly options expiry met a market carrying record leverage, and the VIX jumped 21% in one session to close at 19.99, its highest close since July 29.
Underneath, the story was the same one we have told for a month. The equal weight S&P finished the week up 0.5%. The 10 year yield fell from 5.24% to 5.10%. The selling was concentrated almost entirely in AI hardware and the companies that borrow to build it.
The question this week is not whether AI demand is real. The question is whether the market can wait two more weeks for the hyperscalers to prove it.
Insights from the Proflex Macro Call
Expiry to expiry, full circle. The Nasdaq broke out after the September options expiry and gave all of it back one expiry later. Zoomed out, this is a sideways consolidation, not a meltdown.
The irony of the AI narrative. In January the question was whether AI had revenue. Now a lab doing about $16 billion a quarter and growing 40%+ a quarter is a disappointment. First the market front ran the optimism; now it is front running the pessimism.
Neoclouds are the MicroStrategy of AI. If Nvidia and Microsoft are the Bitcoin of this cycle, CoreWeave and Nebius are the leveraged plays on it. They earn the spread on GPU rent, so Raman watches one number above all: rental rates. They are still rising.
Midterms matter less than earnings. Raman sees the Iran war and the November 3 election as largely priced. The hyperscaler results over the next two weeks will set the direction.
❌ SMH holds $600 through CPI and TSMC (called Oct 12–16). It did not. A hot CPI and the neocloud debt scare took SMH to $539.79, a fraction below its September low. Wrong. ✅ The QQQ higher low is the line that matters (All-Access note, Oct 14). QQQ closed Friday at $709.80, still above its September low of $704.54. Holding, just. ✅ Bitcoin: $80,000 is the floor (called Sep 21–25). Every close last week stayed above $81,000 while the Nasdaq fell 5.5%. Right. ⚪ A falling 10 year lifts equal weight and small caps (called Oct 12–16). The 10 year fell 14 basis points and the equal weight S&P rose, but small caps fell 3.0%. Half right. ⏳ Brent at $120 is the correction trigger (called Sep 14–18). Brent rose 4.9% to $109.86. Closer, not reached. ⏳ Hyperscaler cloud growth will show where open source demand lands (called Oct 12–16). Microsoft reports October 28. Pending.
Key Drivers This Week
OpEx Full Circle: The Index Hides the Damage
Last week we said a break of $600 on the semiconductor ETF would turn the rotation into a correction, and we have to mark that call against ourselves. SMH closed at $539.79, down 10.5% on the week. The Nasdaq 100 closed 1.5% below where it stood at the September 18 expiry.
But the correction stayed in one corner of the market. The S&P 500 is still making higher lows: Friday’s 7,659 sits above its September low of 7,552. We also said that a falling 10 year would give the equal weight index room to catch up. The 10 year fell 14 basis points and the equal weight S&P rose 0.5% while the S&P fell 1.9%.
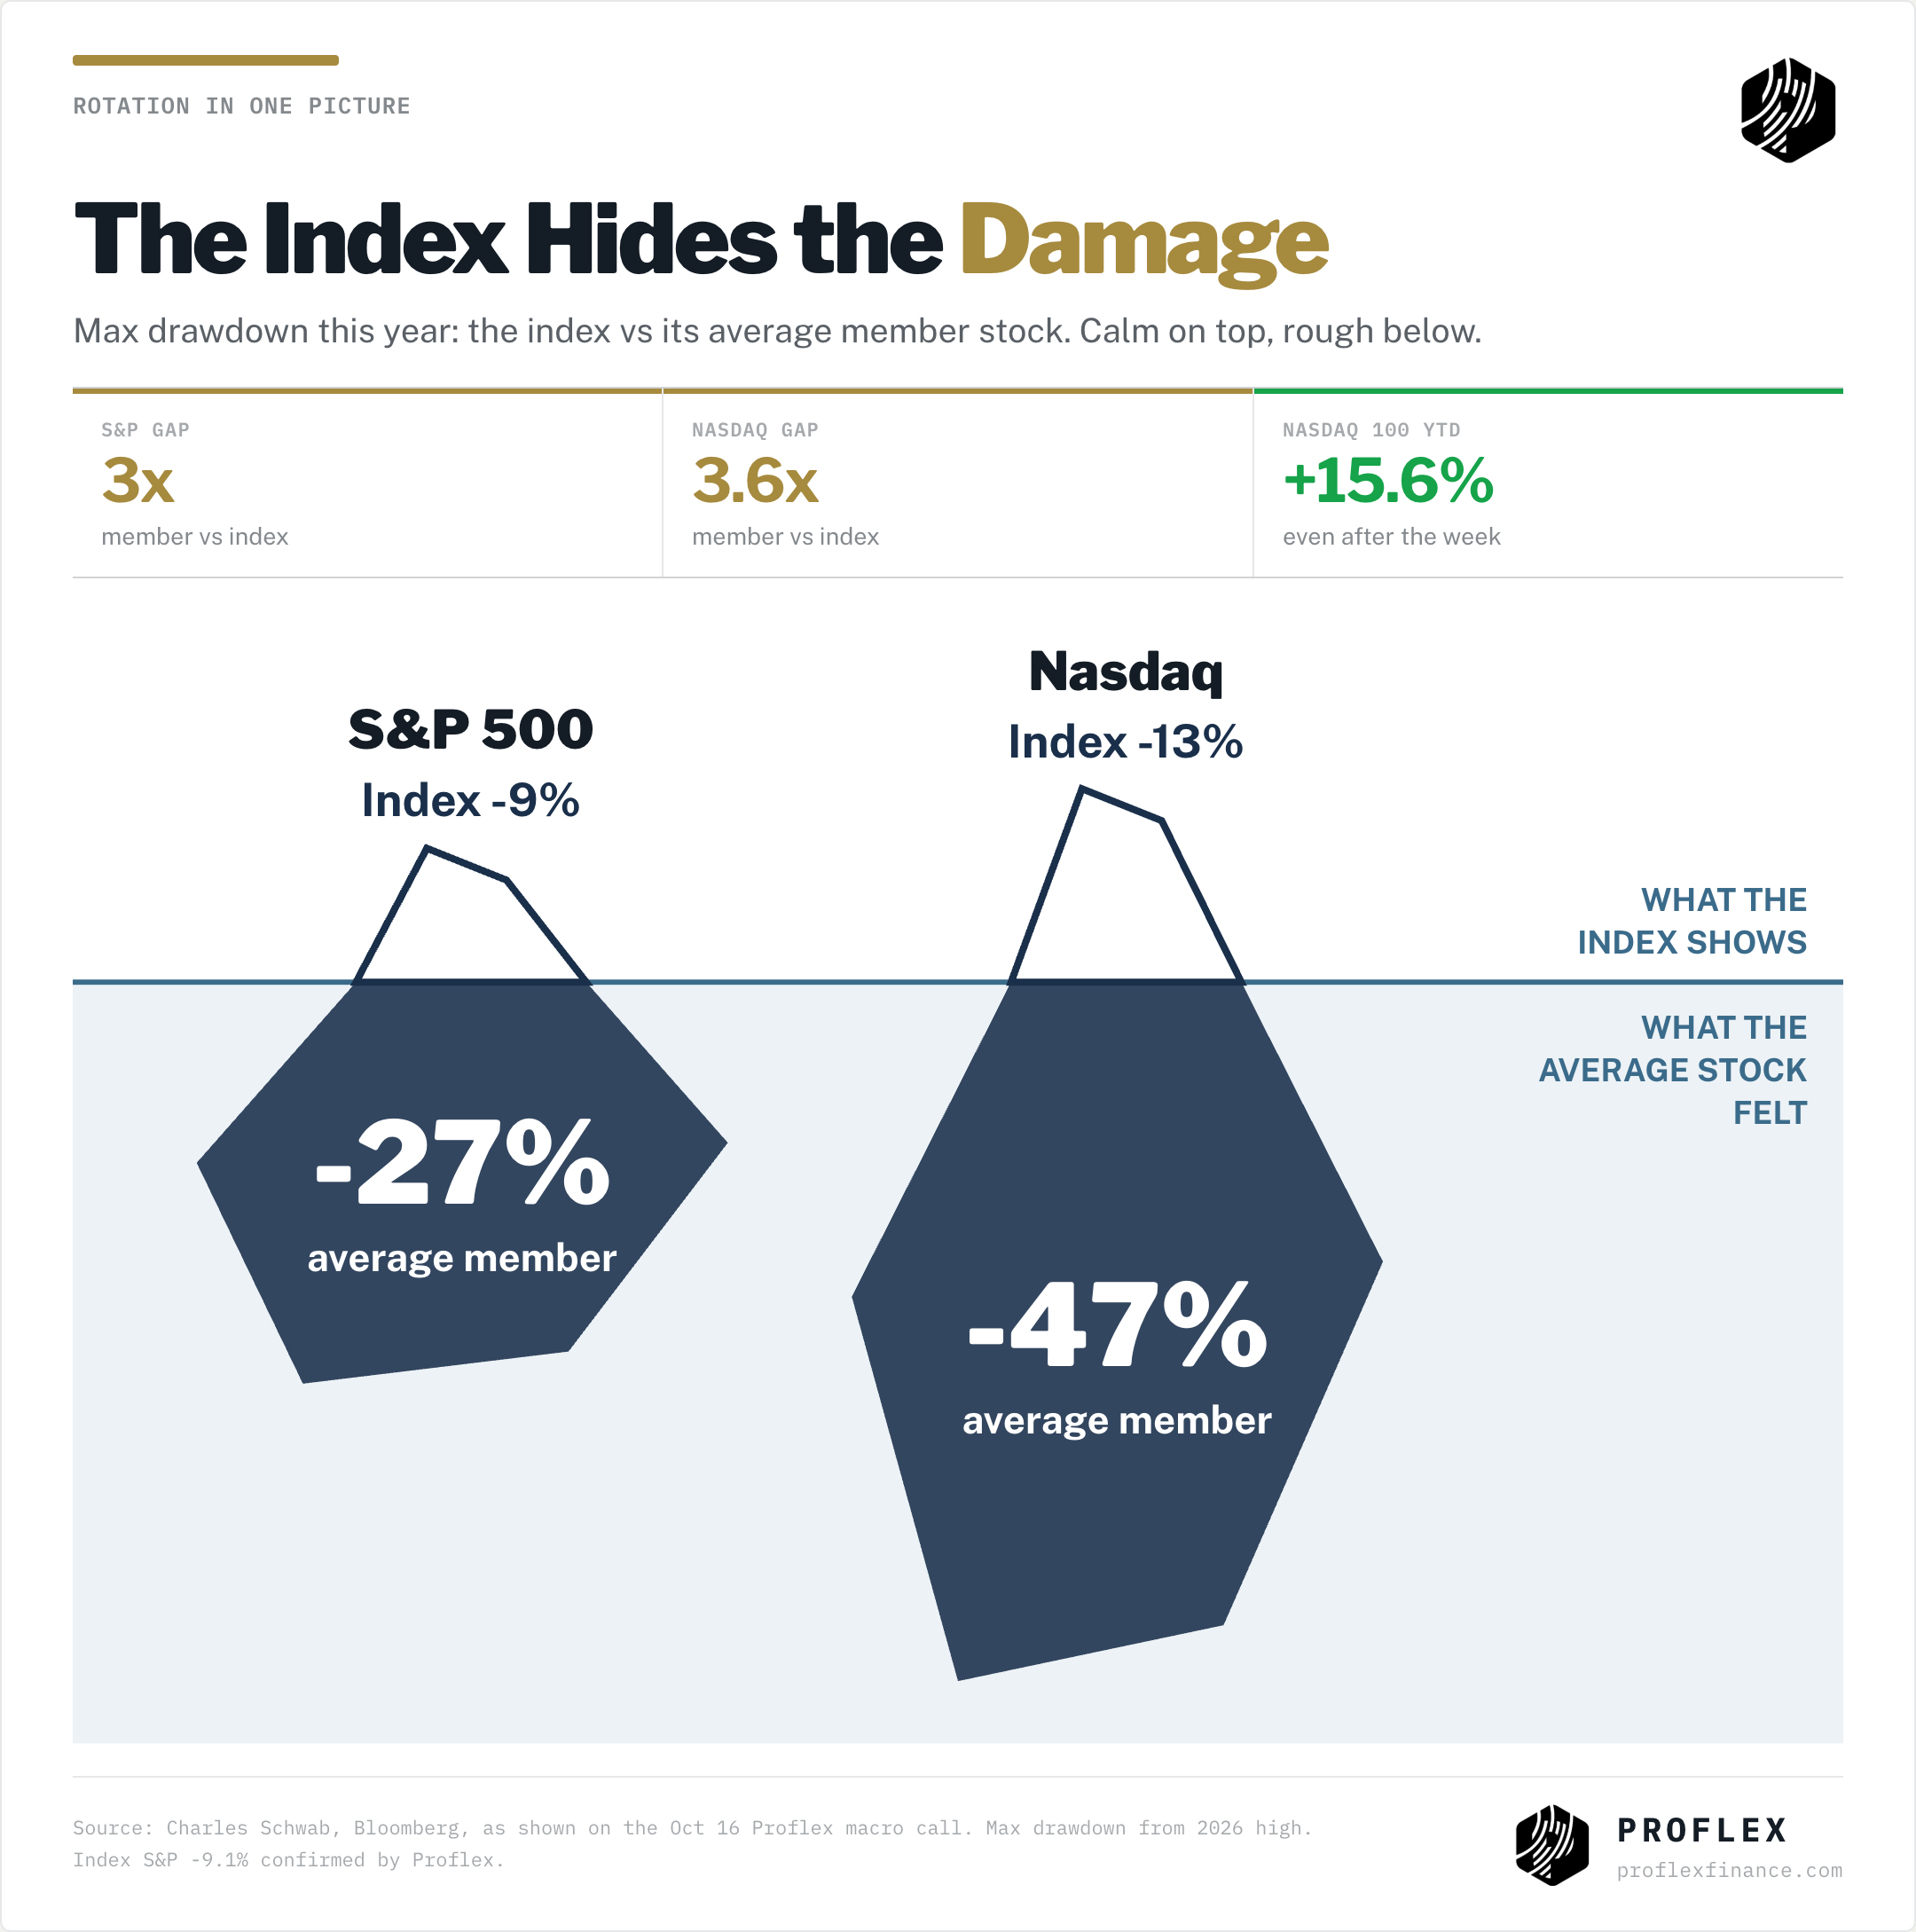
The data Raman showed from Charles Schwab puts this year in one picture. The S&P 500’s worst drawdown this year was about 9%, but its average member stock fell 27% at some point. In the Nasdaq the average member fell 47%, while the Nasdaq 100 is still up 15.6% for the year.
Proflex View: This is a stock picker’s bull market with an index that looks calm. Single stocks fall 30% and recover just as fast, so the index level tells you very little about what you own. The two levels that matter now are the QQQ higher low near $705 and SMH’s September low near $540. Hold those, and this is the same sideways range we have been in since July.
Anthropic and the Moving Goalposts
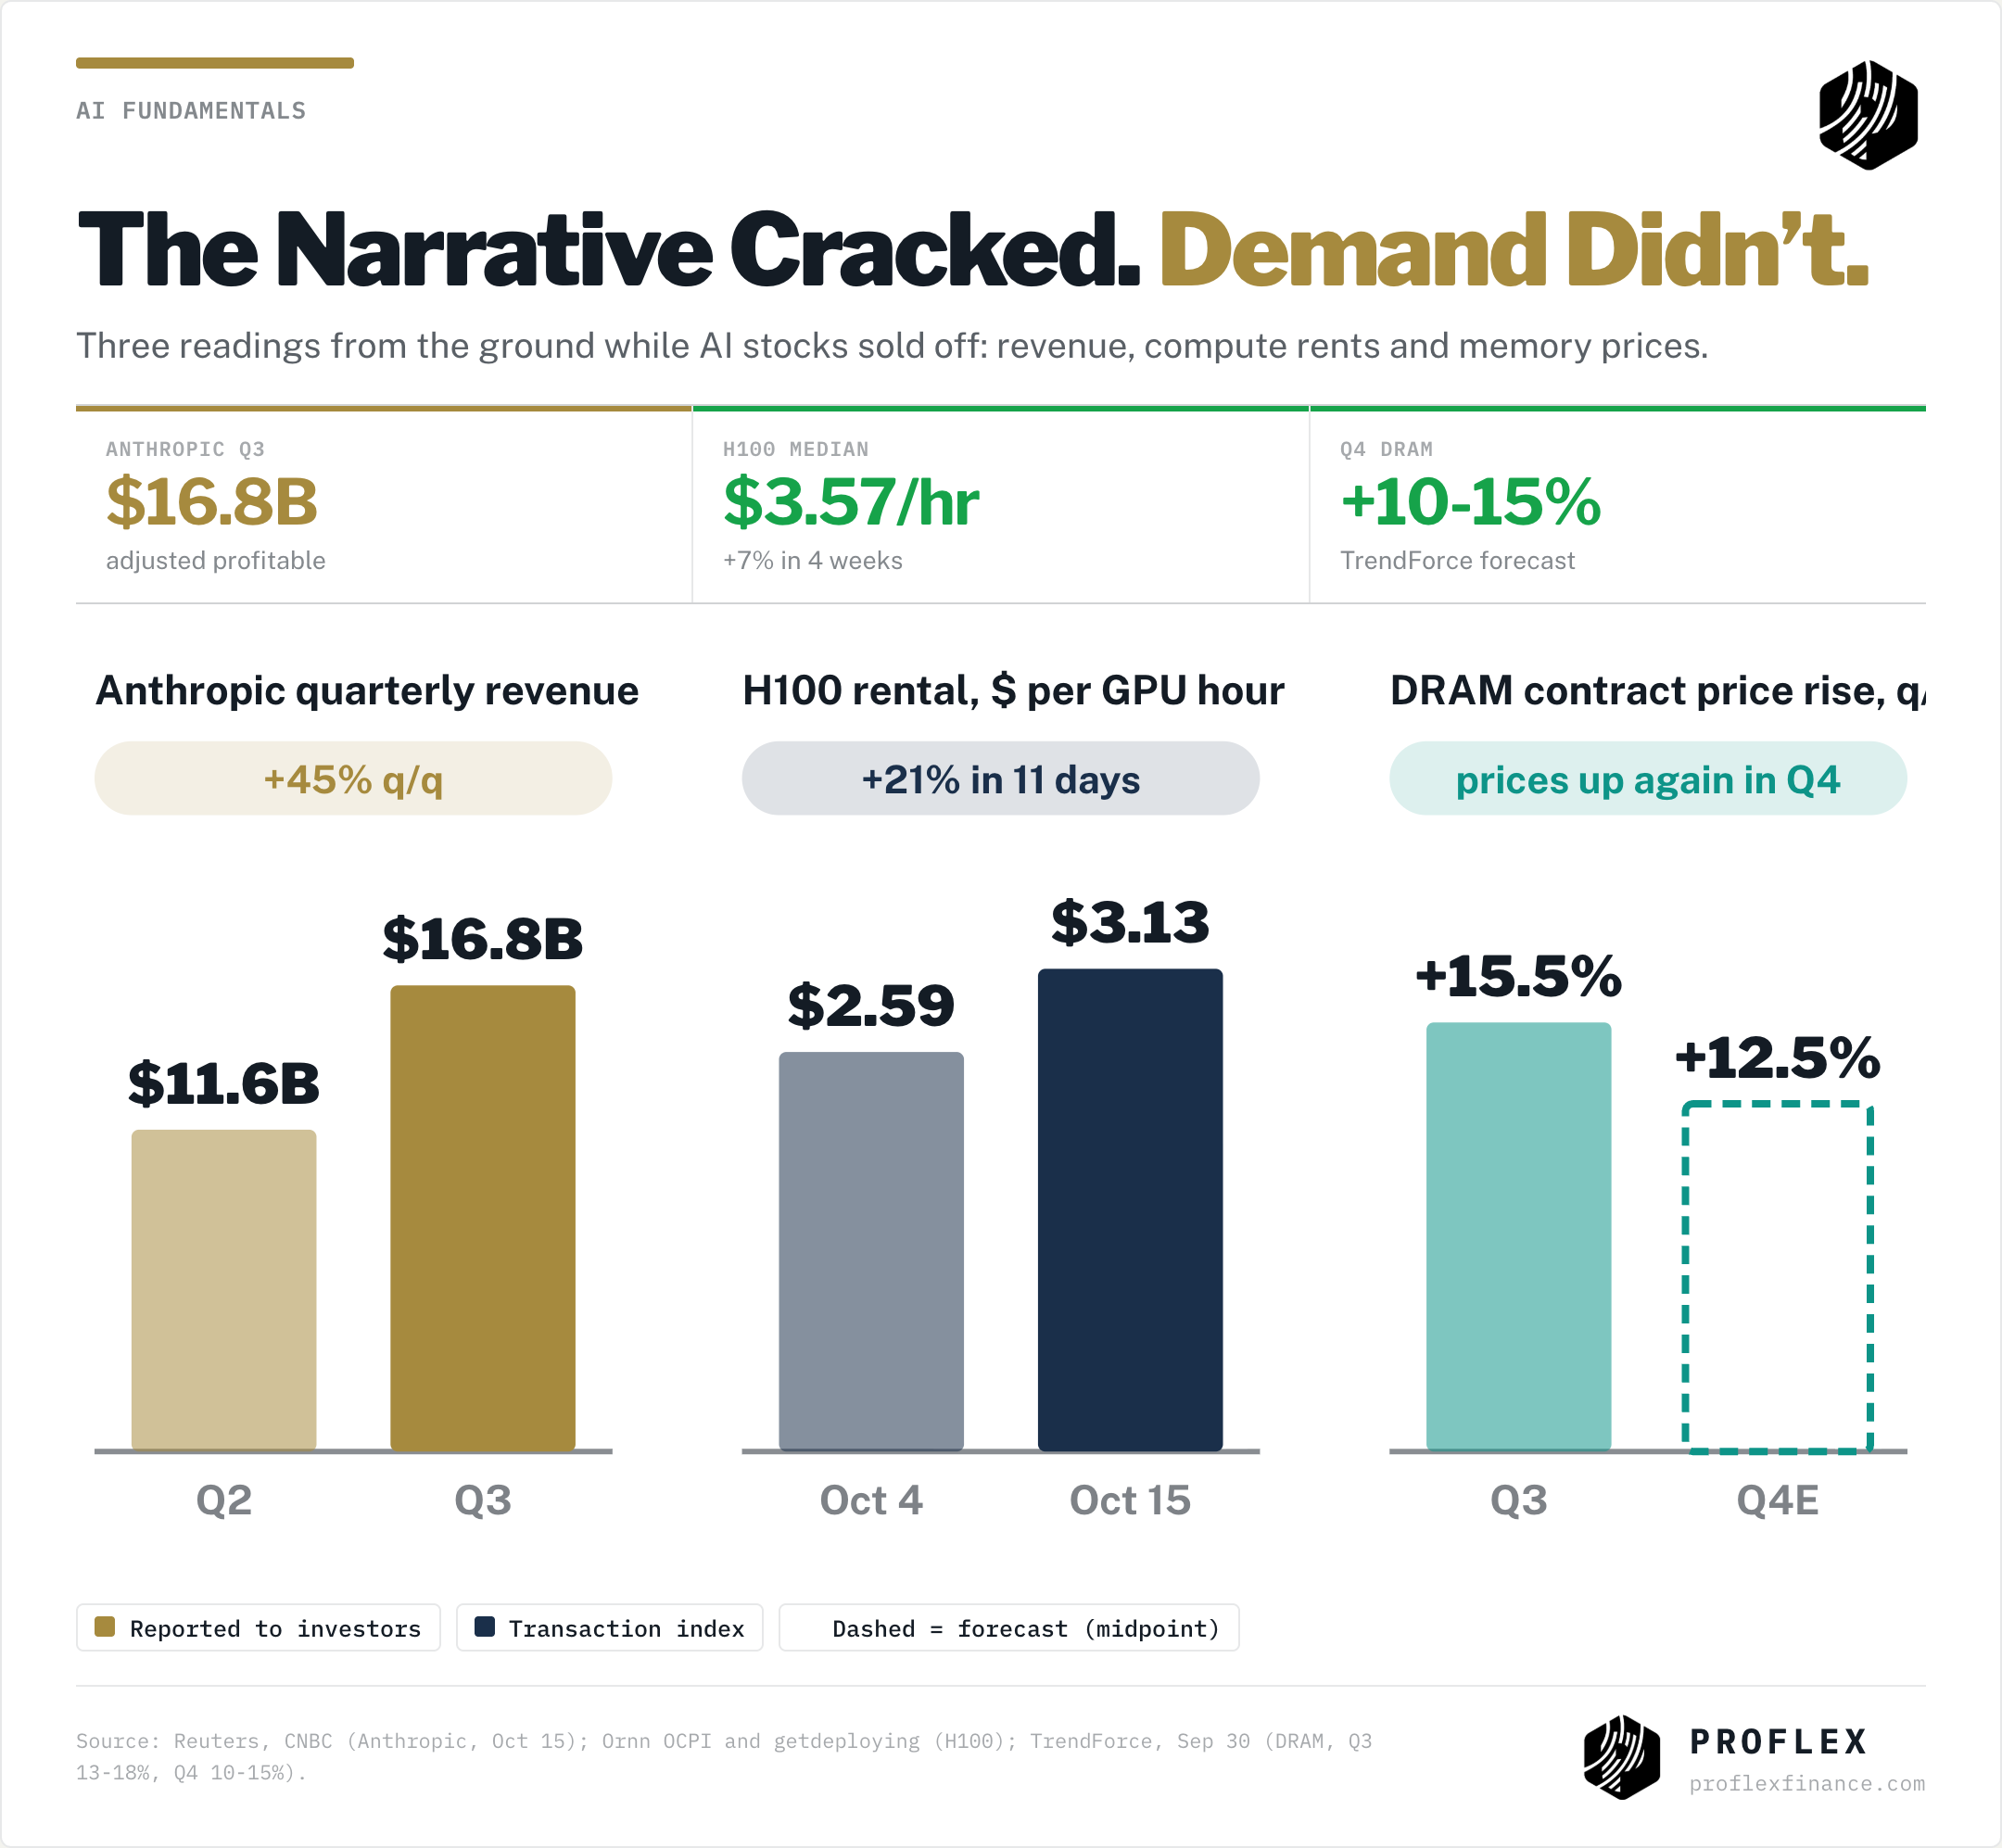
At a closed investor meeting in San Francisco on October 14, Anthropic told prospective IPO investors that third quarter revenue rose 45% from the previous quarter to $16.8 billion, and that it was profitable on an adjusted basis (Reuters, CNBC). The problem was the comparison: second quarter revenue had more than doubled, to $11.6 billion. According to Reuters, some investors at the meeting discussed a valuation of about $1.5 trillion for the November listing, down from the roughly $2 trillion they had expected.
Free Weekly Insights
Get This Analysis Every Week
Join 250+ investors at Google, Amazon & Apple who start their week with Proflex.
No spam. Unsubscribe anytime.
$16.8 billion a quarter is about $67 billion a year, still growing 45% a quarter. A business at that scale cannot keep doubling. Meanwhile the readings from the ground improved all week. Ornn’s H100 rental index rose from $2.59 an hour on October 4 to $3.13 on October 15. The median H100 price across 41 providers is up 7% in four weeks (getdeploying). TrendForce expects conventional DRAM contract prices to rise another 10% to 15% in the fourth quarter.
Proflex View: A $1.5 trillion or a $2 trillion IPO is a debate about price, not about demand. The frontier labs are only part of the AI economy. As Raman put it, much of the new demand is going to open source and custom models running on the hyperscalers, and that shows up in Microsoft, Alphabet and Amazon results, not in Anthropic’s. Rising GPU rents are the clearest sign that the demand is still there.
Neoclouds: The MicroStrategy of AI
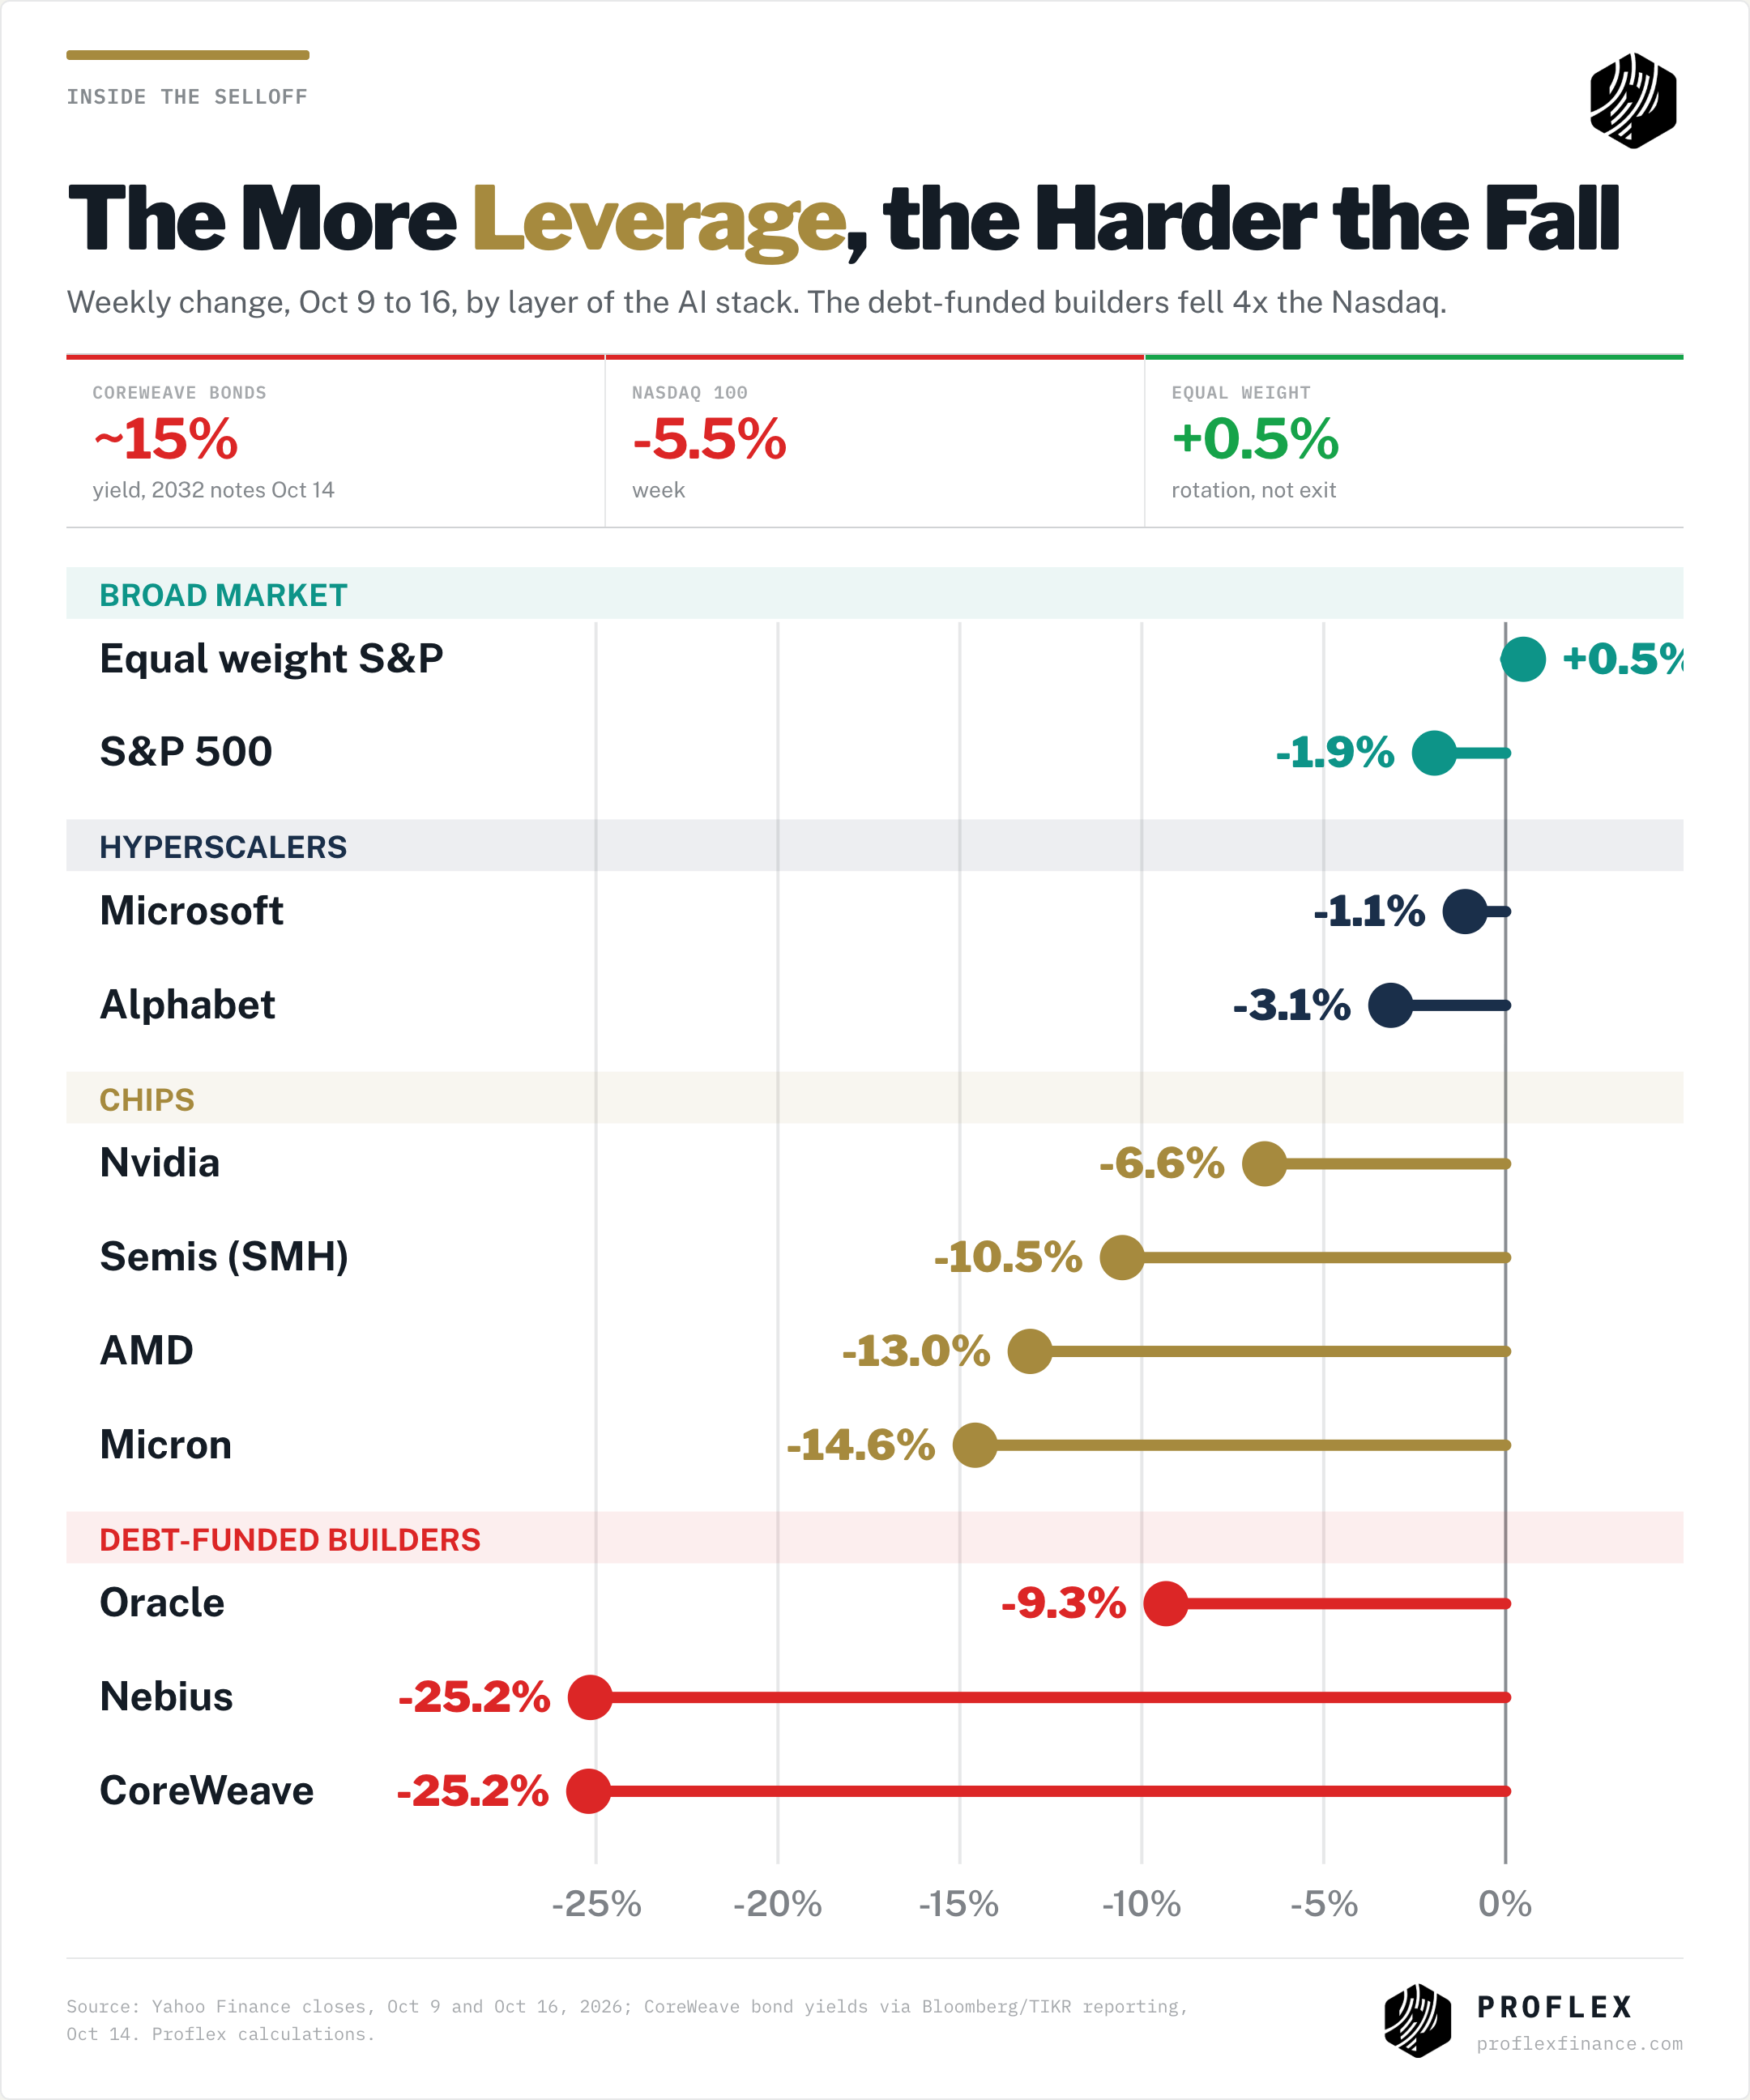
CoreWeave and Nebius both fell 25.2% on the week, CoreWeave dropping 15.5% on Wednesday alone. Its 9.625% notes due 2032 traded at a yield near 15% that day (Bloomberg). CEO Mike Intrator called the reaction irrational and pointed to a contracted backlog that covers its debt. The bonds recovered part of the drop on Thursday.
Raman’s point: the 15% headline ignores the rest of the capital structure, where senior debt secured by the GPUs and by contracts with customers such as Microsoft costs far less. Add an unconfirmed rumour on Thursday that an AI fund called VARA was under pressure, and this looked a lot like July’s forced liquidation of Situational Awareness.
In late July we wrote that the fundamentals did not break, the leverage did. The same pattern held last week. Margin debt hit a record $1.50 trillion in June (FINRA), and when it unwinds the most leveraged layer of the trade falls hardest. The broad market barely moved.
Proflex View: The neoclouds are a leveraged bet on GPU rents, and GPU rents are rising. That makes this a financing scare, not a demand scare. Expect these names to swing two to four times as much as the Nasdaq in both directions, and size them that way.
VIX Above 20: Liquidation or Turning Point?
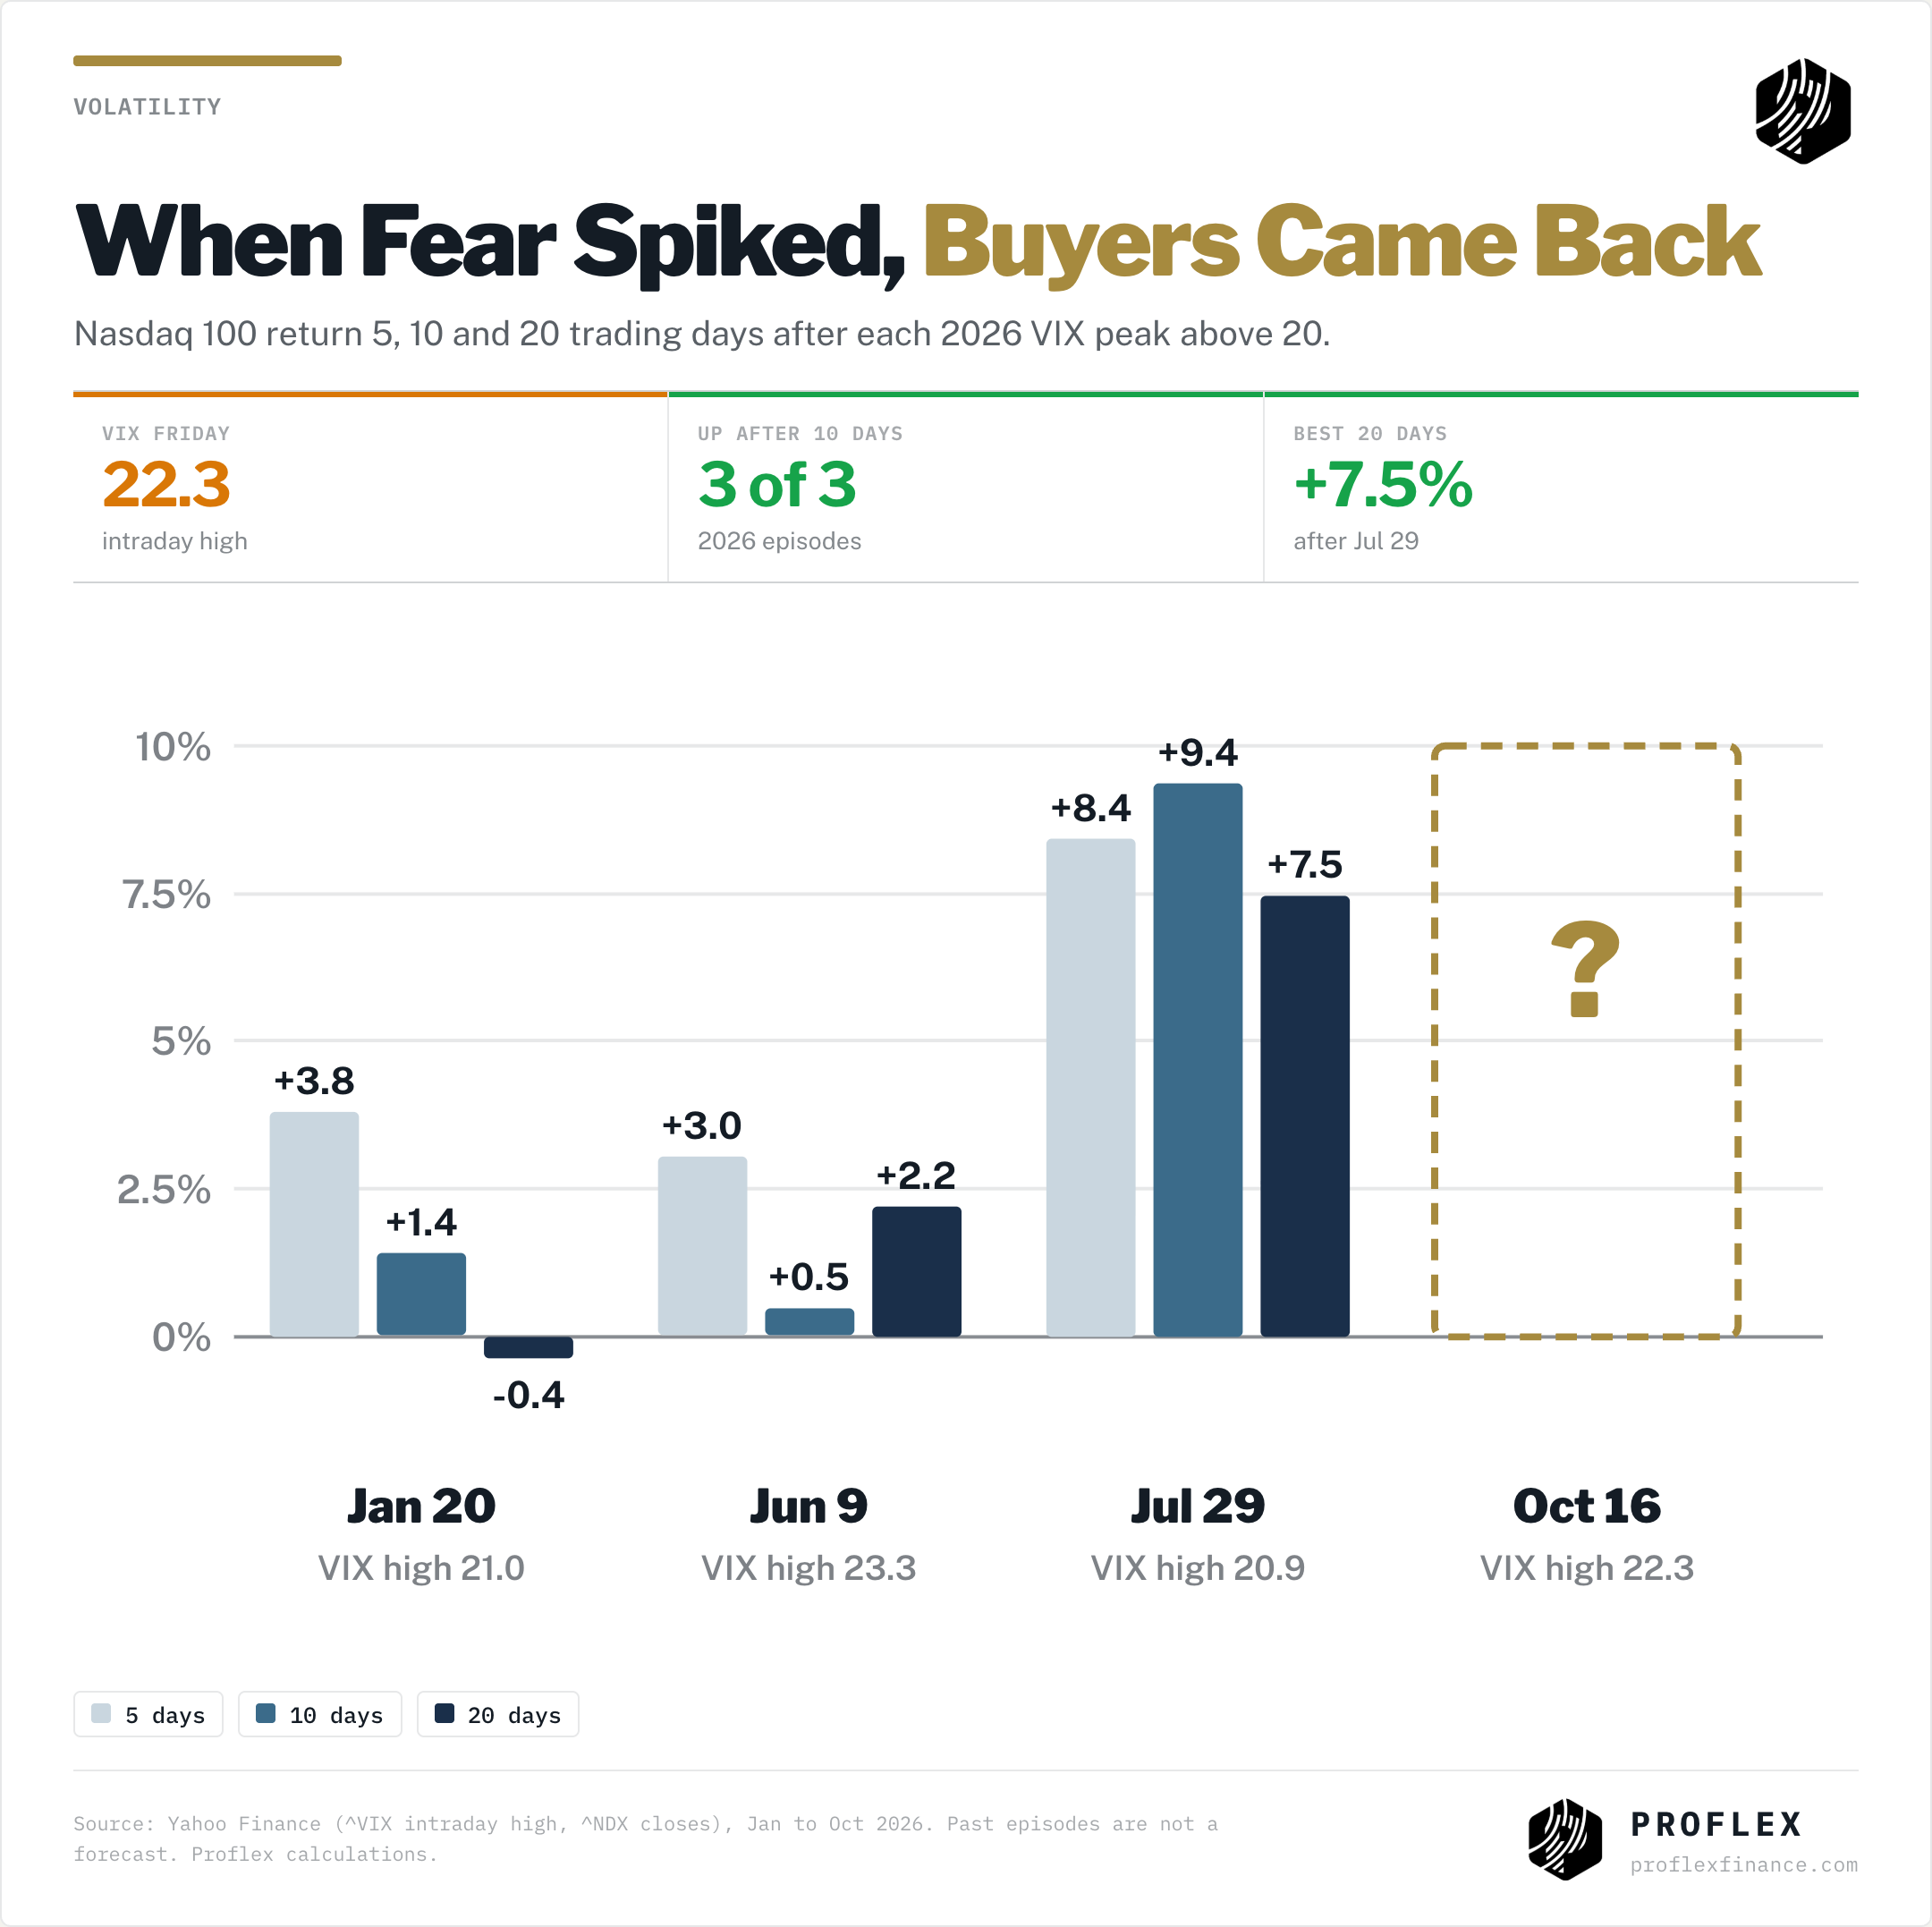
Friday’s VIX traded as high as 22.3, on a day when the October expiry met record leverage. Raman overlaid the VIX on the Nasdaq to see what happened the last times it pushed above 20. In each of the three 2026 episodes, the Nasdaq 100 was higher 10 trading days later. After the July 29 peak it was up 9.4%.
Tap into real-time commentary from Proflex experts on market shifts, policy cycles, and global events—alongside daily discussions from 190+ Silicon Valley CTOs, CEOs, family offices, and seasoned HNIs.
Three episodes is not a forecast. But it fits what our members heard on Thursday. In our October 15 All-Access note we issued a buy zone on our AI positions, because the AI data was stronger than at the July 29 flush. Friday went lower still, so that call is pending. The day before, Growth Gazette members booked 71.6% of the premium on a Ciena covered call with five weeks left to expiry.
Proflex View: Expiry days in a leveraged market produce liquidation lows, not fundamental ones. With the October expiry behind us, that mechanical selling pressure resets. Spikes above 20 have been buying moments in 2026. We are treating this one the same way until the earnings data says otherwise.
Macro: Yields Ease, but Oil and CPI Keep the Fed Live
September CPI rose 3.7% from a year earlier, up from 3.4% in August, with gasoline doing most of the work. Core rose to 2.6% from 2.4% (Reuters). CME FedWatch odds of a hike on October 28 jumped from about 22% before the print to between 40% and 52% during the day (Reuters, Yahoo Finance). The fed funds rate sits at 3.75% to 4.00% after September’s hike.
Even so, the 10 year fell to 5.10% as money moved into bonds. The Atlanta Fed’s GDPNow model has third quarter growth at 3.6%. Brent rose 4.9% to $109.86. Since mid September we have named Brent at $120 as the trigger for a real correction. Raman’s read is that the White House is not easing pressure on Iran before the midterms, so oil stays the black swan.
Bitcoin slipped 1.3% to $81,501 but never closed below $81,000 all week. In September we said $80,000 was the level to watch on Bitcoin. Holding it through a 5.5% Nasdaq drop shows that risk appetite has not gone. Gold slipped 0.8% to $4,181 and is steadying.
Proflex View: A 3.7% CPI makes October 28 a real decision, and a hike on the same afternoon Microsoft reports would test the market. But falling long yields, a 3.6% growth nowcast and Bitcoin holding $80,000 do not describe a market losing its appetite for risk. They describe one waiting for data.
🔍 What We’re Watching
The QQQ higher low near $705 and SMH’s September low near $540. Hold both and this is the July pattern again
GPU rental rates. Raman’s single best signal that AI demand is holding
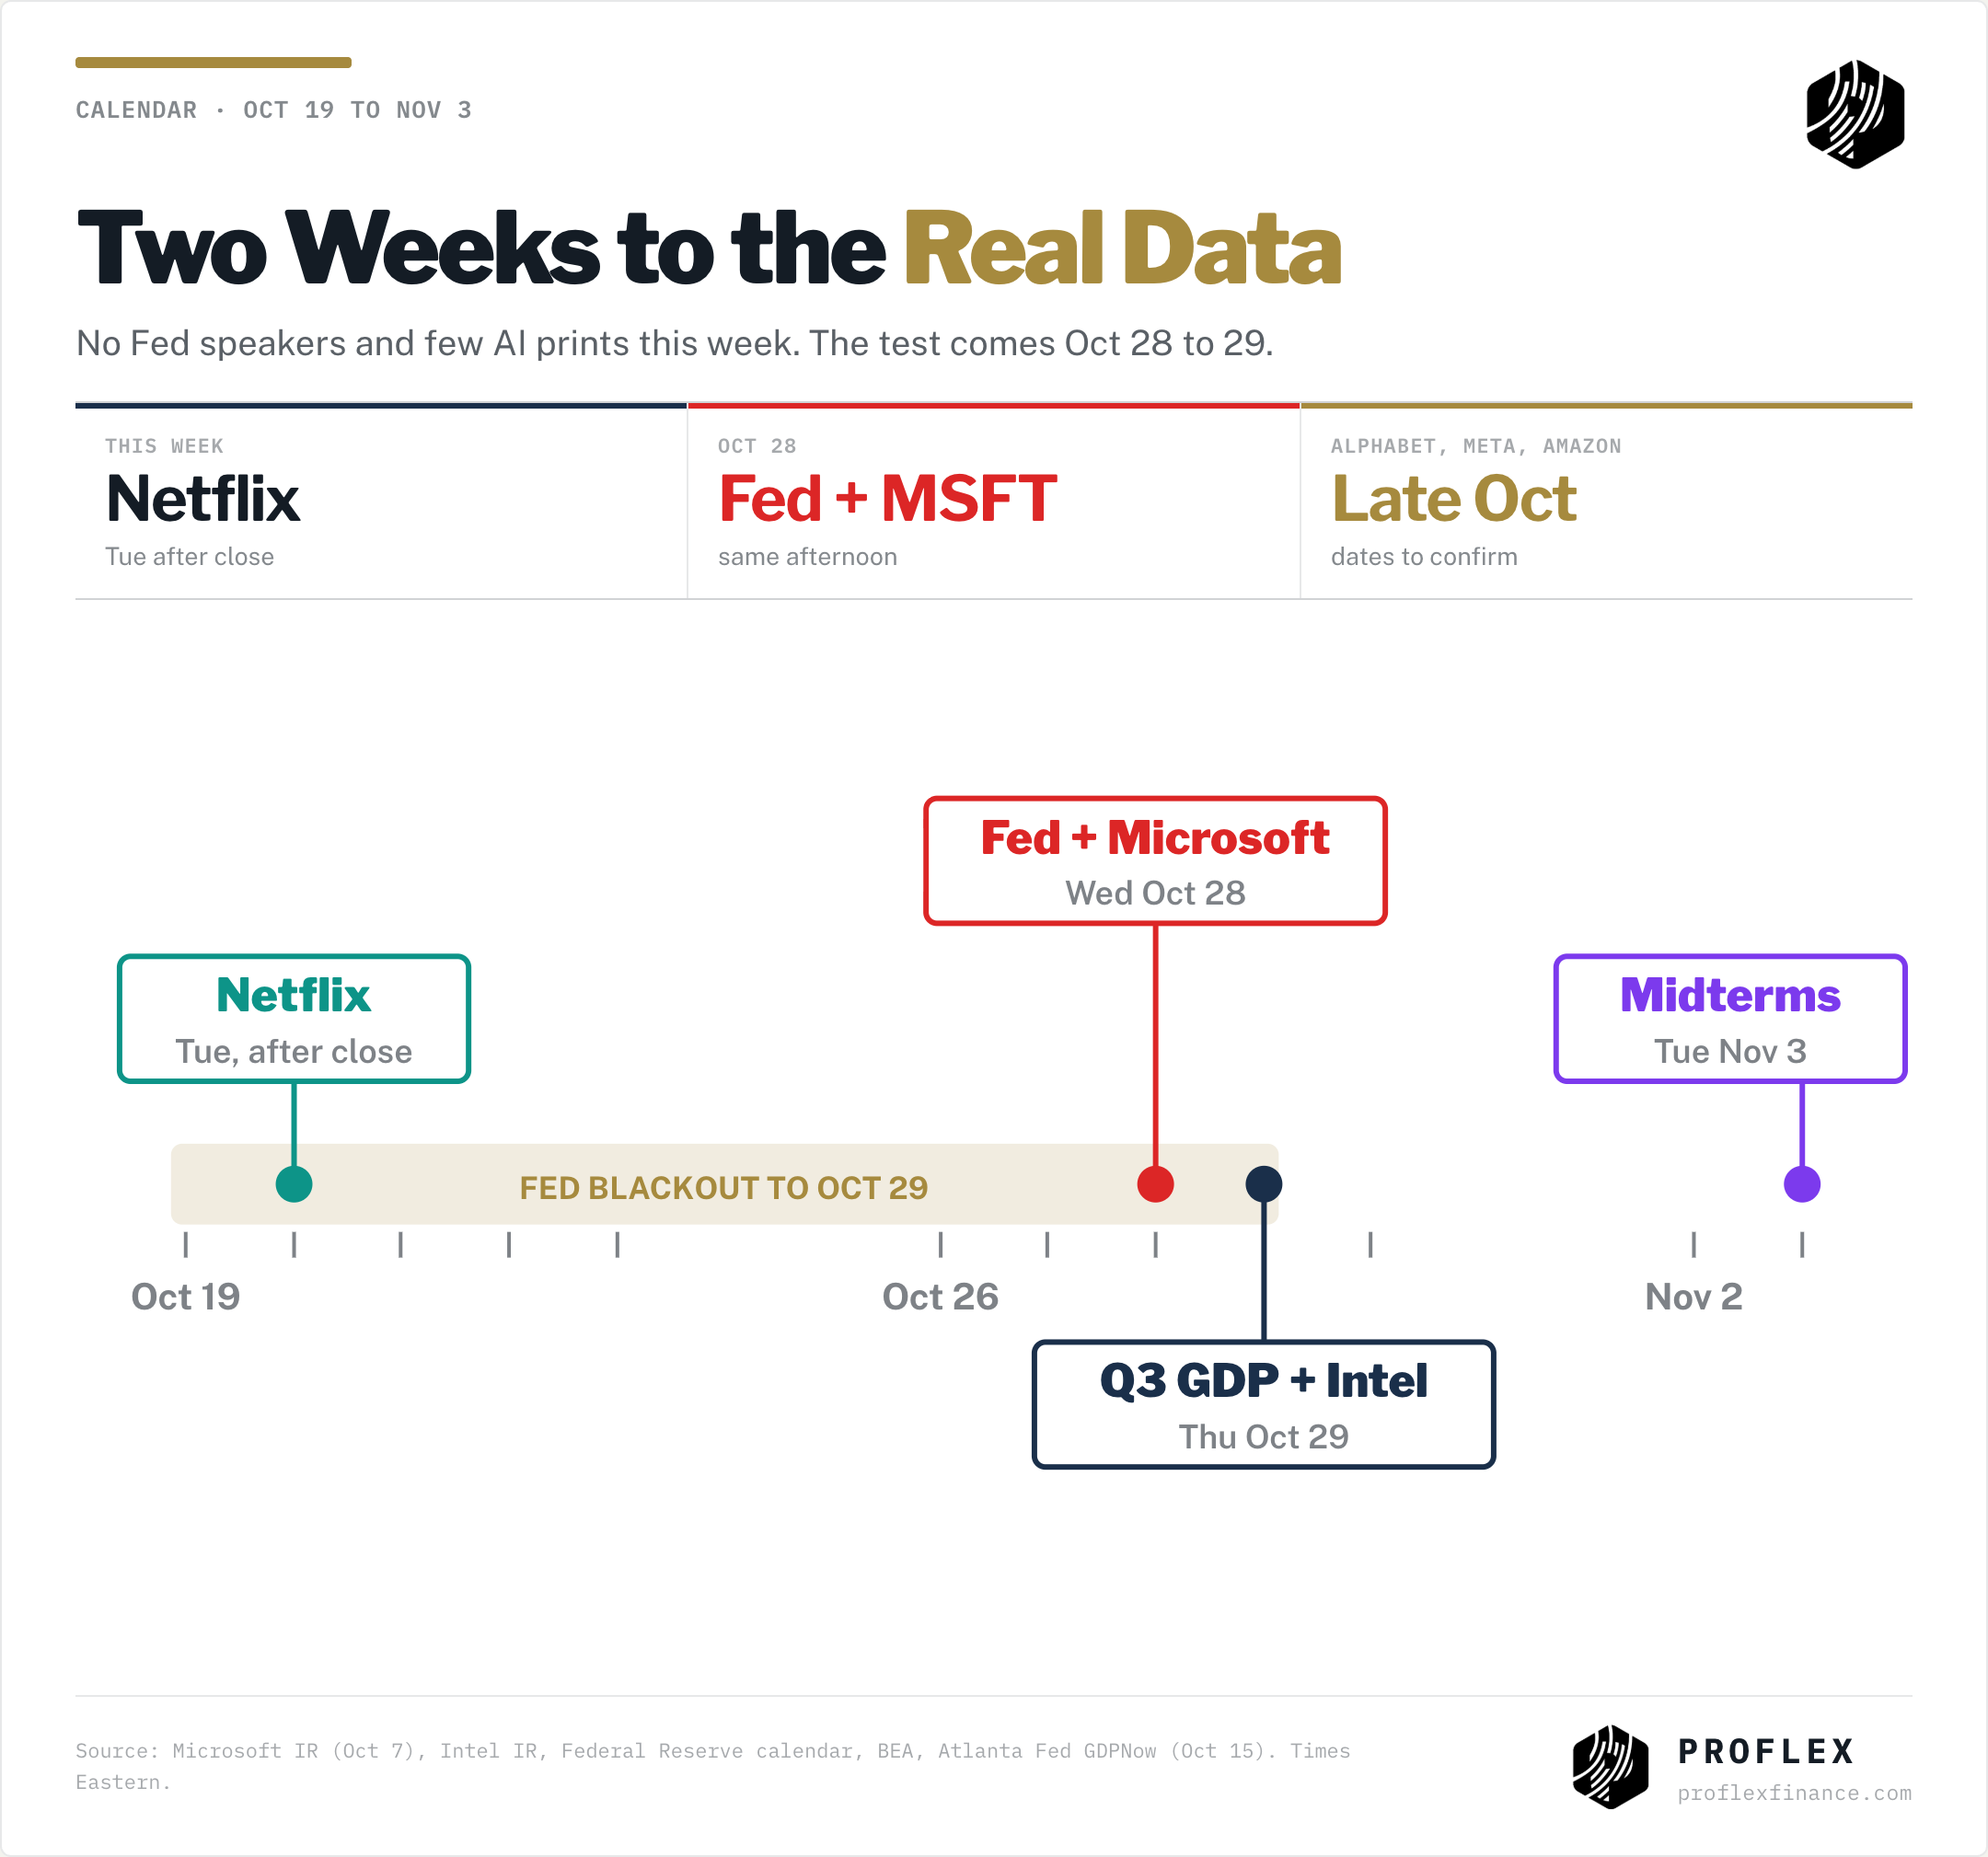
Netflix on Tuesday, then a quiet tape until October 28: the Fed decision and Microsoft the same afternoon
Q3 GDP and Intel on October 29, with Alphabet, Meta and Amazon due in the same window
Brent against $120, and the Anthropic IPO marketing expected in November
Bitcoin holding $80,000
🧭 Proflex Playbook – Trade the Data, Not the Narrative The narrative flipped from optimism to fear in six months while the data kept improving. Leverage makes the flushes deep and the recoveries fast. Keep position sizes small enough that an expiry day cannot force a sale, add to the businesses whose revenue keeps compounding, and let the hyperscaler prints, not the headlines, decide the next move. Our conviction stays anchored in the data:
Focus on Structural Growth: Continue to overweight the secular AI theme, recognizing its multi-year runway.
Anticipate Shallow Corrections: Use dips as accumulation opportunities, not reasons for fear, understanding that "none of the corrections stick."
Diversify Thoughtfully: Recognize the "decorrelation" across asset classes; consider gold, silver and Bitcoin for portfolio resilience.
Develop Mental Models: Prioritize long-term planning (6-12 months out) over short-term news, aiming for consistent, incremental gains.
If you're an All-Access or Managed Portfolio subscriber, our positioning has already shifted ahead of this moment—scaling up asymmetric hard asset plays while hedging for earnings volatility and geopolitical tail risks.
Proflex All-Access: Your Market Compass
Explore the financial markets with Proflex All-Access, your comprehensive resource for deeper market understanding and active participation. This premium service offers subscribers exclusive insights and actionable investment advice, giving you a significant edge in various market conditions.
Proflex All-Access provides detailed analyses and recommendations to optimize your investment strategy. Our specialized newsletters include:
• Growth Gazette (Contains Crypto Pulse) : Aimed at achieving above-market returns for aggressive portfolio growth.
• Income Insider: Focused on conservative strategies and income generation for yield-seeking investors.
Until next week, — The Proflex Team Trusted Macro Insights. Calm Investing. Tactical Trades.
Elevate your financial IQ
ProFlex® by Proflex Finance Legal Disclosures
ProFlex® by Proflex Finance, the premium newsletter product series, provides informational and educational content only and does not offer personalized investment advice or establish a fiduciary relationship. While we rely on reliable sources and research, the information is not tailored to individual financial situations. Readers are urged to consult qualified financial professionals before making investment decisions. We do not guarantee the accuracy, completeness, or timeliness of the information and are not responsible for any investment decisions based on this newsletter. Investing carries risks, and past performance doesn't predict future results. By accessing this newsletter, you acknowledge that we are not liable for actions or decisions resulting from its content. Please conduct due diligence and seek professional advice as needed.
Frequently Asked Questions
Options expiration (especially quarterly "triple witching") can create significant short-term volatility as dealers unwind hedging positions. Gamma exposure determines whether dealer hedging amplifies or dampens moves. Negative gamma environments can accelerate selloffs, while positive gamma tends to suppress volatility. Large open interest strikes often act as price magnets into expiry.
Earnings reports reveal actual business performance versus market expectations. Revenue growth, profit margins, and forward guidance drive stock re-ratings. Beats or misses relative to consensus estimates move individual stocks and can shift sector-wide sentiment. Earnings season also provides insight into broader economic health and consumer spending trends.
Sector rotation signals include divergence between growth and value indices, relative strength shifts in sector ETFs, credit spread movements, and changes in the yield curve. When defensive sectors outperform cyclicals, it often signals risk-off positioning. Monitoring small-cap (Russell 2000) relative to large-cap performance provides insight into economic confidence and risk appetite.
The Fed targets 2% inflation measured by the PCE index. When CPI or PCE readings come in above target, the Fed may maintain or raise rates to cool the economy. Below-target readings give the Fed room to cut rates. Markets watch these releases closely because they signal the direction of monetary policy.
Oil prices are driven by supply-demand dynamics, OPEC+ production decisions, geopolitical tensions in producing regions, and global economic growth expectations. Rising oil prices increase input costs for businesses, pressure consumer spending, and can signal inflationary pressures that influence central bank policy.