Bonds vs Equity: The Decision Point | Muse Takes AI Mass Market | Semis Hold $600 | Oracle and the Bottleneck Risk
"The 10 year is at its highest since 2007 and the S&P rose anyway. Bonds are pricing the cost of the AI build out; equities are pricing the payoff. One of them has to blink." — Proflex Panel
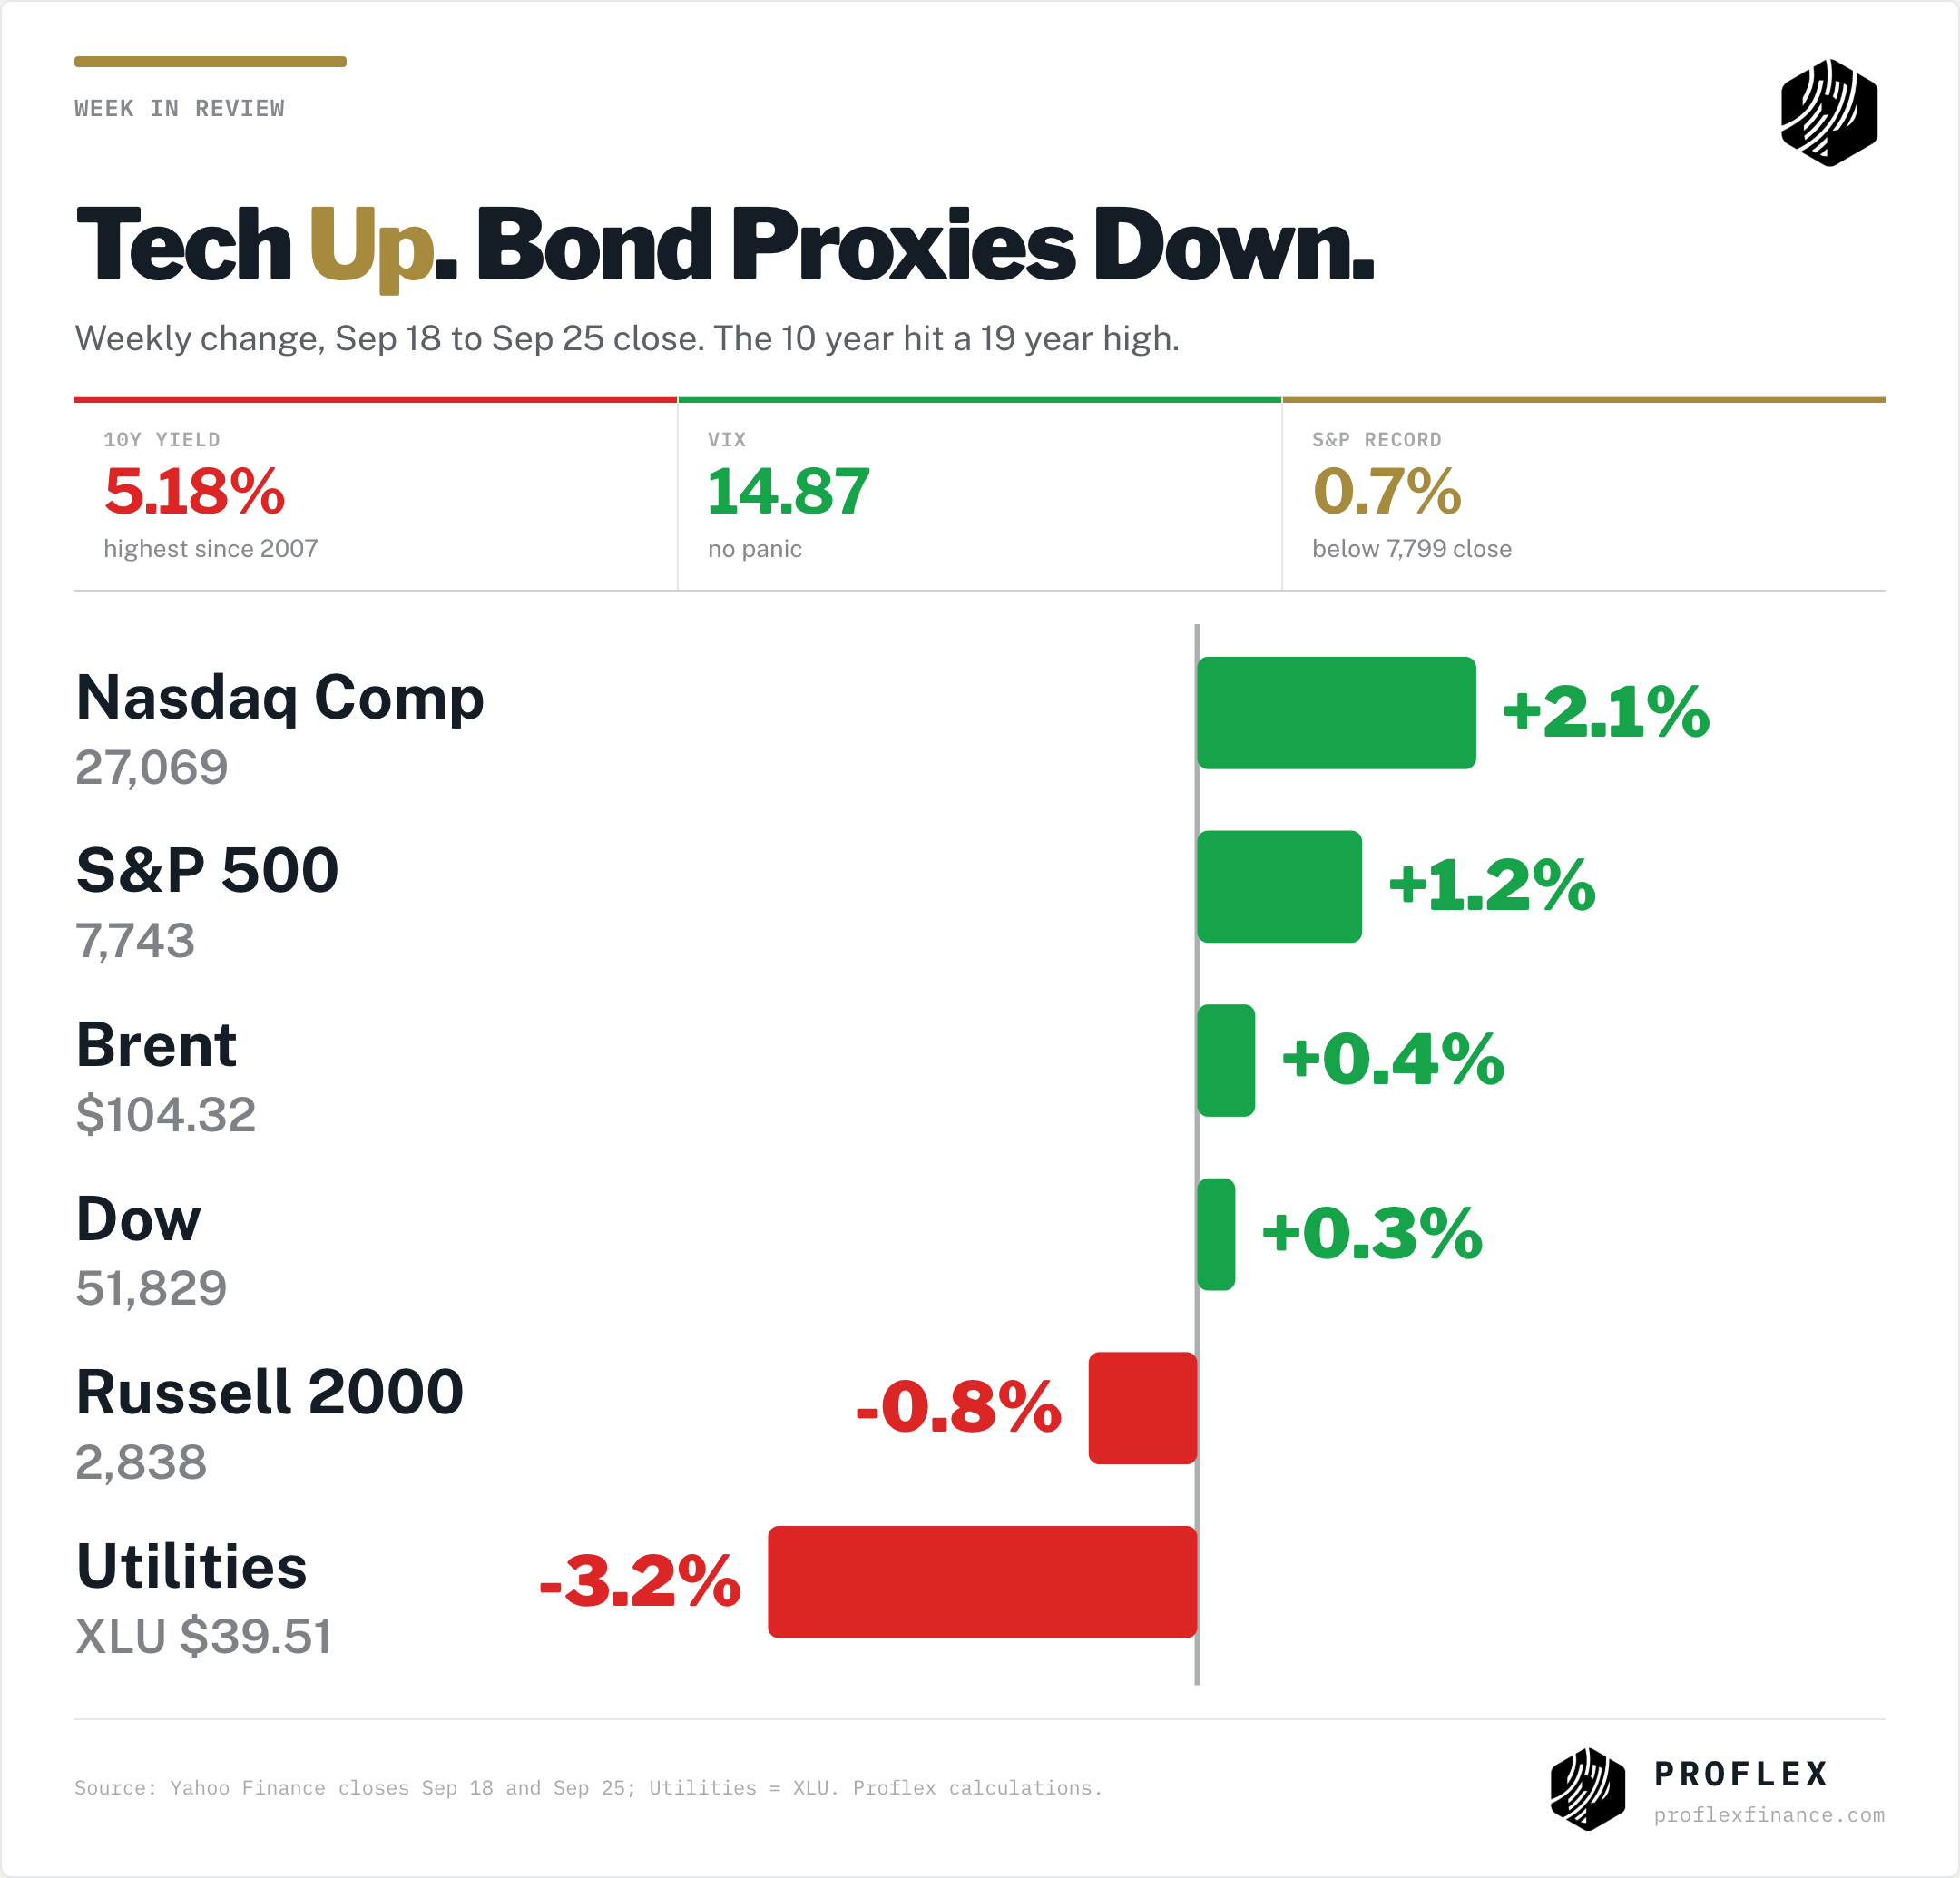
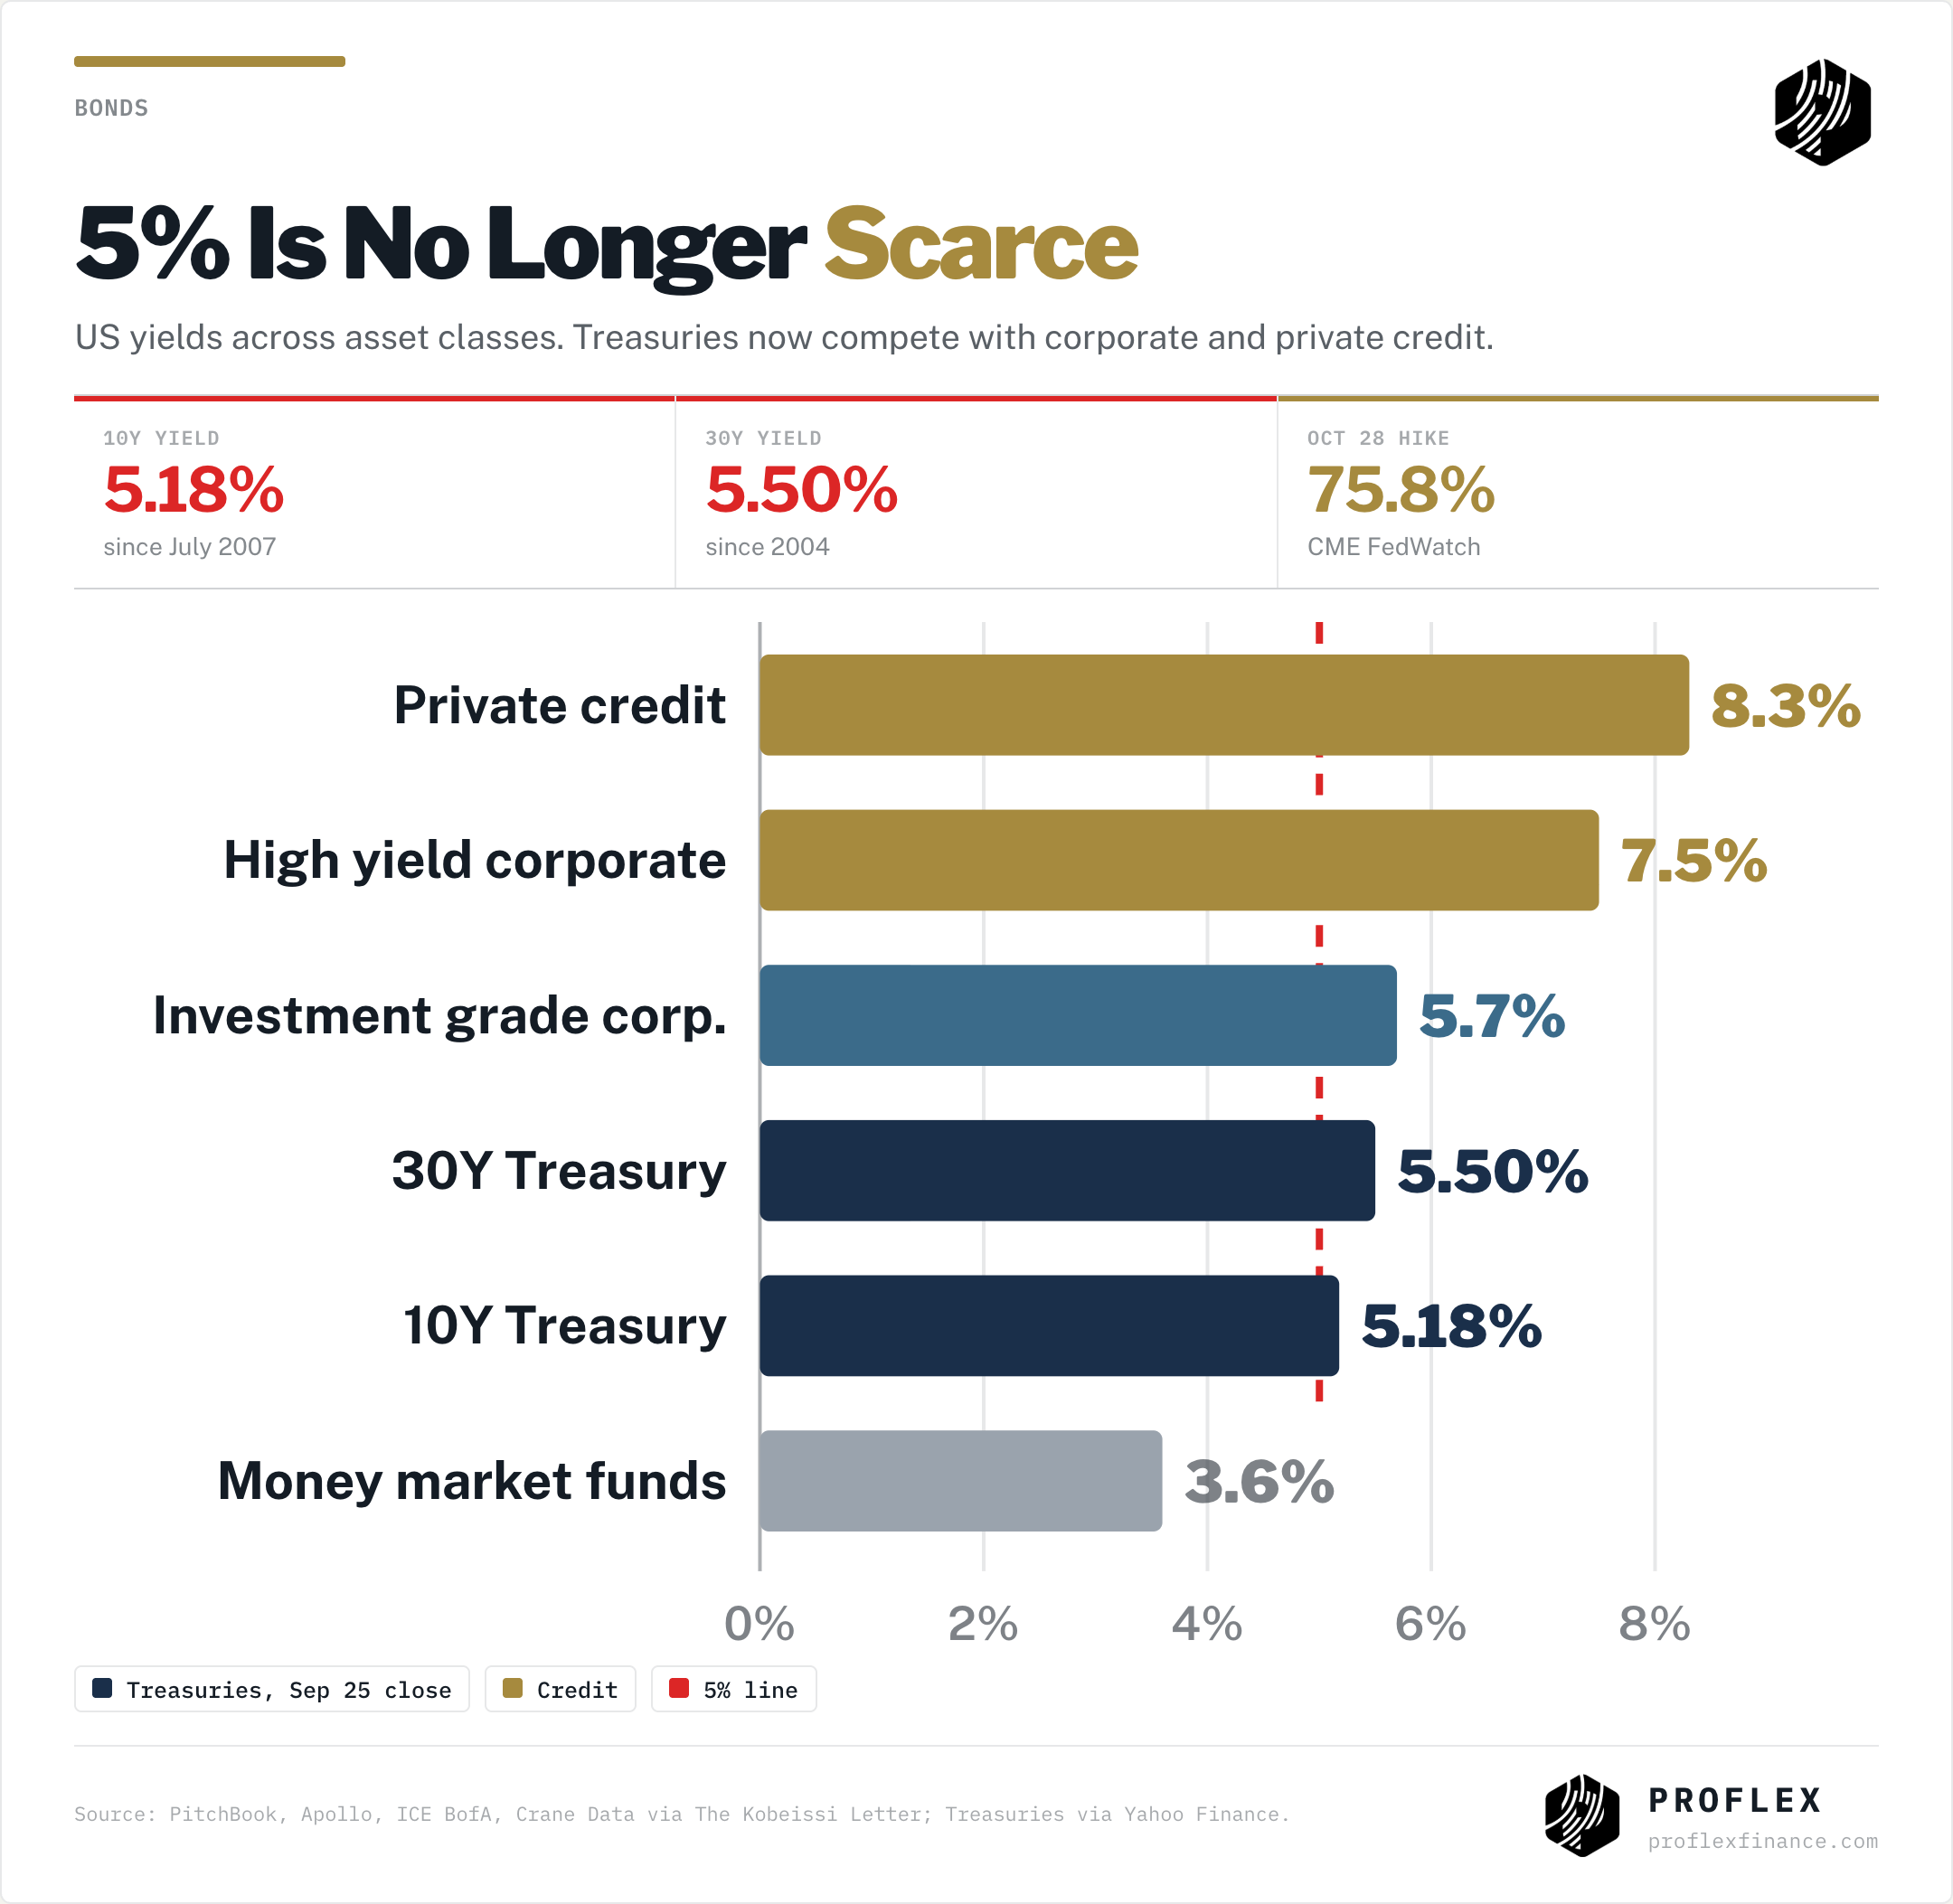
The 10 year Treasury closed Friday at 5.18%, its highest since July 2007. On Wednesday it jumped about 15 basis points, the biggest one day move since April 2025, after a business activity survey came in at a five year high. The 30 year closed the week at 5.50%, a level last seen in 2004.
Equities did not care. The S&P 500 rose 1.2% to 7,743, the Nasdaq gained 2.1% to 27,069 after two record closes early in the week, and the VIX finished at 14.87. The technology sector ETF rose 3.6%. Utilities (-3.2%) and real estate (-1.5%), the sectors that trade like bonds, fell hardest.
That split is the story. Bonds are pricing the cost of the AI build out, which is increasingly funded by debt. Equities are pricing the payoff, and this week delivered the clearest evidence yet that the payoff can reach ordinary users, not just developers.
Insights from the Proflex Macro Call
The bond market is not finding buyers at 5%. The market assumed 5% would pull money out of equities and into bonds. It has not. Foreign demand from buyers like China has faded, and for a fund in Asia, a Google or Amazon bond is now as good a dollar asset as a Treasury. Those same companies, plus private credit deals for AI, are adding to the supply.
Volatility says the market is not panicking. The VIX spiked around the VIX options expiry and came straight back. Equity is still seen as the best place to be, because of what Raman calls "the AI promise".
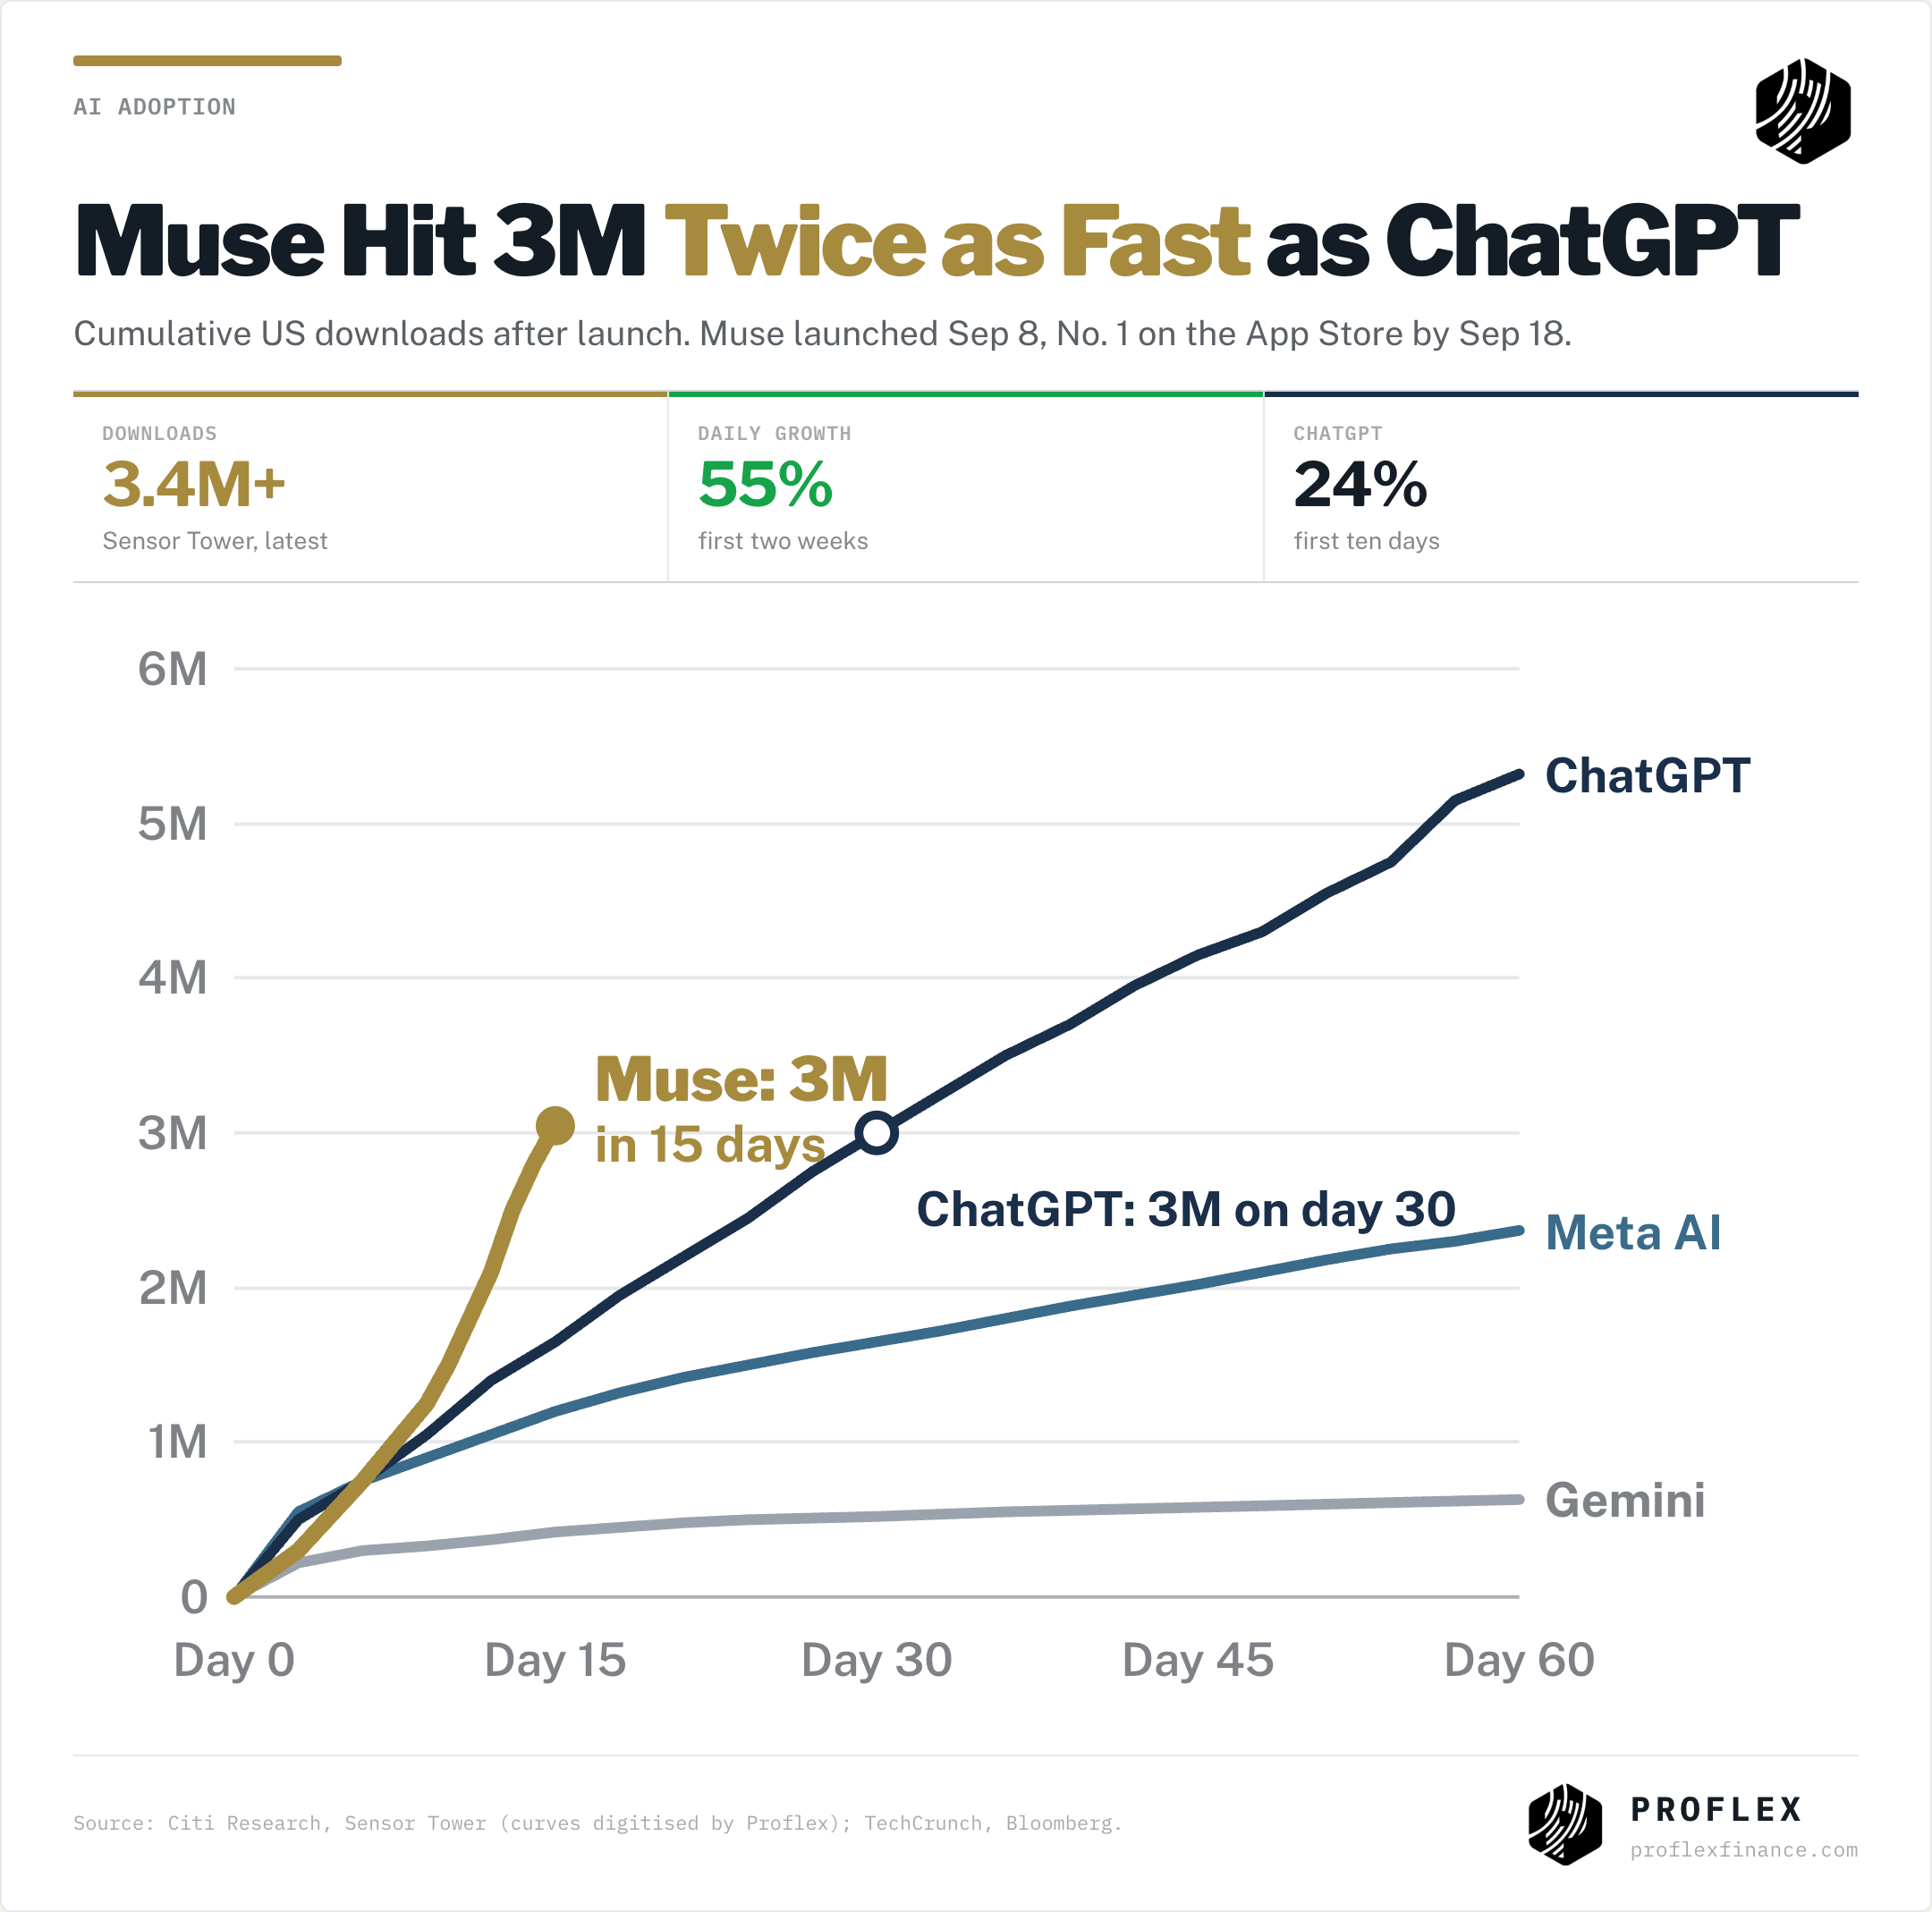
Meta’s Muse is the first mass market AI launch from a company that already has the users. ChatGPT had to start from zero. Meta starts with its distribution. That is why Muse matters more than another model release.
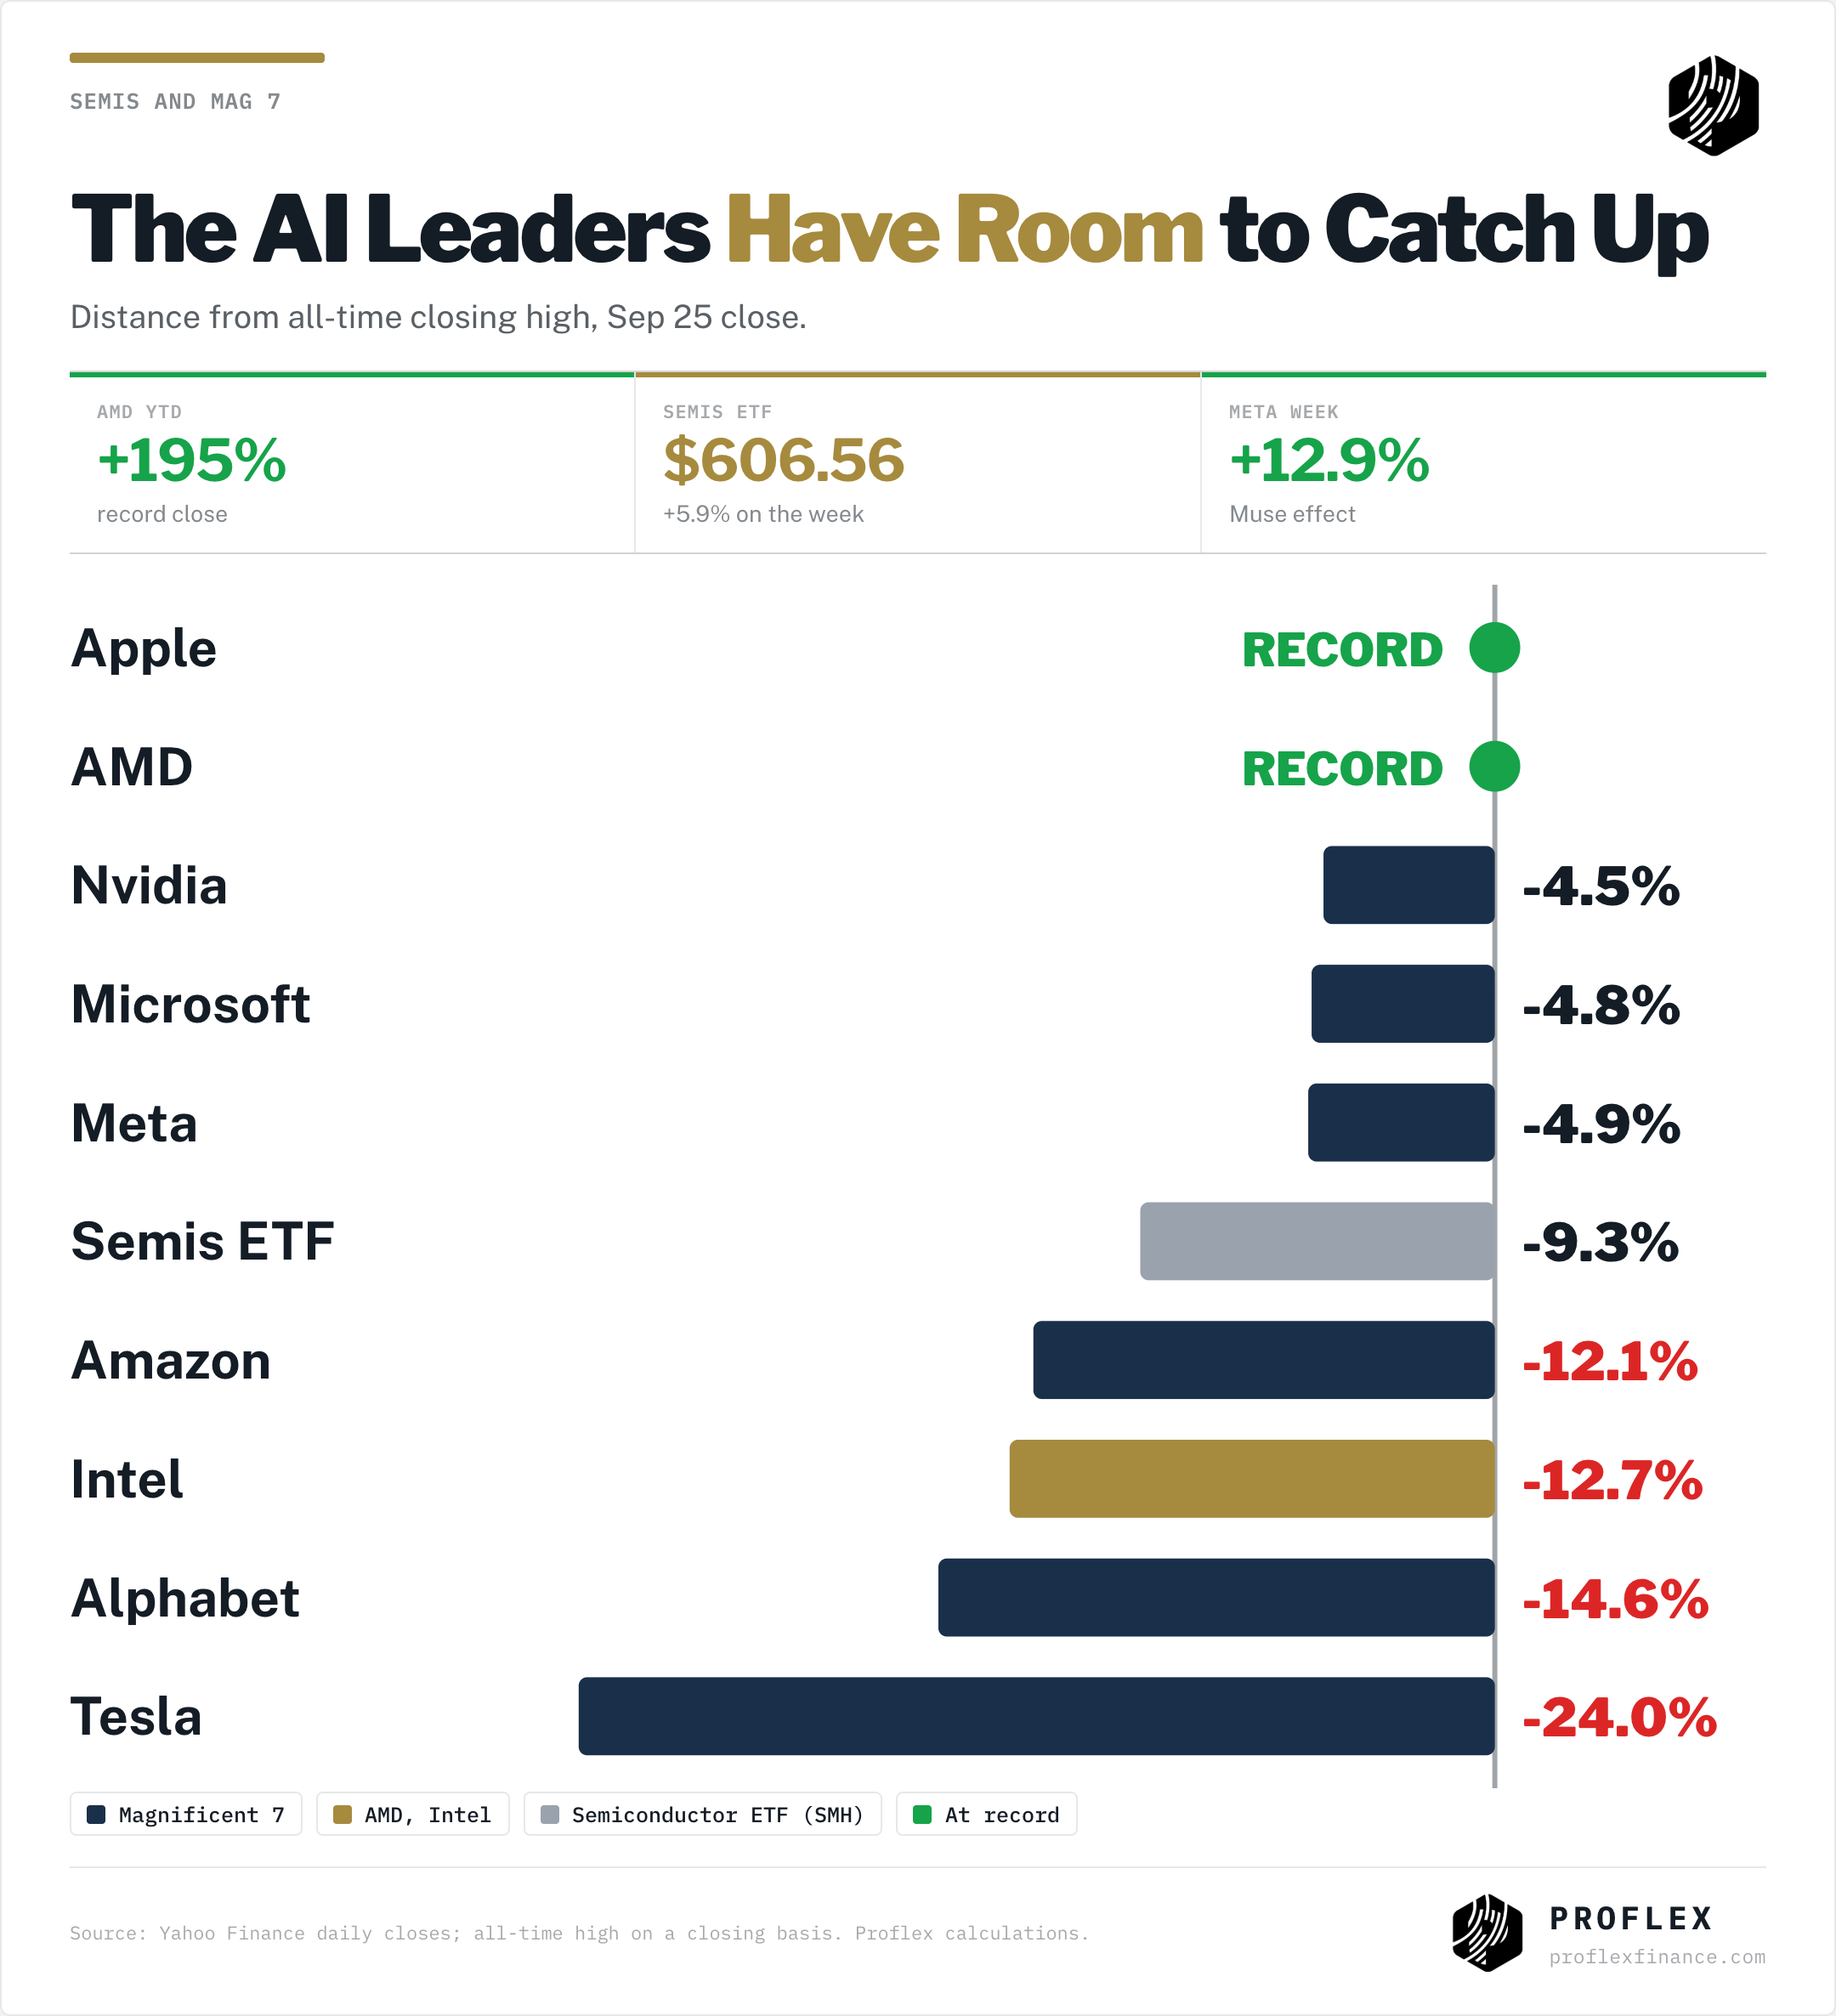
The index is near its high while the AI leaders are not. Alphabet and Amazon are well below their highs. The rally is being led by momentum names like AMD and Intel. For the S&P to break out, the discounted leaders just need to join in.
Earnings are where the rubber hits the road. Two years of spending drove this market. From October, investors want to see monetization.
The move was driven by growth, not fear. S&P Global’s September PMI showed US business activity at a more than five year high, with new orders surging and price pressures broadening. Fed Governor Barr said the Fed will "likely need to deliver further interest rate hikes". Futures now put the odds of an October 28 hike at 75.8% (CME FedWatch).
Last week we said the Fed going from "will it hike" to "how many" would not break this market, and that we saw it adjusting to higher rates. The long end did not hold 5%. It went through it. And the S&P still rose 1.2% on the week, within 0.7% of its 7,799 record close.
Proflex View: A 10 year at 5.18% is a real cost of capital, and it is showing up where it should: in utilities, real estate and small caps (the Russell 2000 fell 0.8%). The rest of the market is looking past it because growth is strong. The line that matters is 5%. A move back toward it calms everything. A push toward 5.5% on the 10 year starts to compete with equities for real.
Muse Takes AI Beyond The Developers
Meta launched Muse on September 8. By September 18 it was the number one app on the US App Store, and it has held the spot since. Sensor Tower puts downloads at more than 3.4 million, with daily download growth averaging 55% in its first two weeks, against 24% for ChatGPT’s first ten days (TechCrunch, Bloomberg). It launched only in North America.
The market read it immediately. Meta rose close to 13% on the week. AMD, which supplies Meta with both GPUs and EPYC CPUs under a 6 gigawatt deal, closed at a record and briefly passed a $1 trillion market value. Intel and Arm followed, on the view that agents running around the clock need far more CPUs. Microsoft rose 3.7% on Friday to its highest close of the year after relaunching Copilot with coding and an always on "Autopilot" agent.
And at the enterprise end, Anthropic is now targeting a November IPO, with annualized revenue expected to pass $100 billion this year, up from about $9 billion at the end of 2025 (New York Times, Wall Street Journal).
Free Weekly Insights
Get This Analysis Every Week
Join 250+ investors at Google, Amazon & Apple who start their week with Proflex.
No spam. Unsubscribe anytime.
Proflex View: For six months the AI story was about developers and coding. Muse is the first proof that a consumer AI product can scale on distribution alone. That changes the demand math for everything underneath it, CPUs and memory as much as GPUs. The Q3 earnings season will show whether it shows up in revenue.
Semis Hold The $600 Line
Last week we said a close above $600 on the semiconductor ETF was the level that confirms the AI trade is leading again. It closed above $600 on four straight days from Tuesday and finished Friday at $606.56, up 5.9% on the week. The Nasdaq printed back to back record closes at 27,122 and 27,244 on Monday and Tuesday.
It is not yet a clean breakout. The ETF is still about 9% below its June record, and the Nasdaq gave back part of its gains midweek. Raman’s point is that the room above is large. AMD is up about 195% this year and Apple closed at a record, while Alphabet (-14.6%), Intel (-12.7%) and Amazon (-12.1%) remain well below their highs.
Proflex View: $600 was the test and it is being passed, not yet confirmed. What confirms it is the laggards joining in. Micron reports on Wednesday after the close, with consensus at $31.56 of EPS on about $51.2 billion of revenue (Alphastreet). That is the next fundamental test of whether AI demand is broadening or just rotating.
Oracle Shows The Other Risk: Bottlenecks
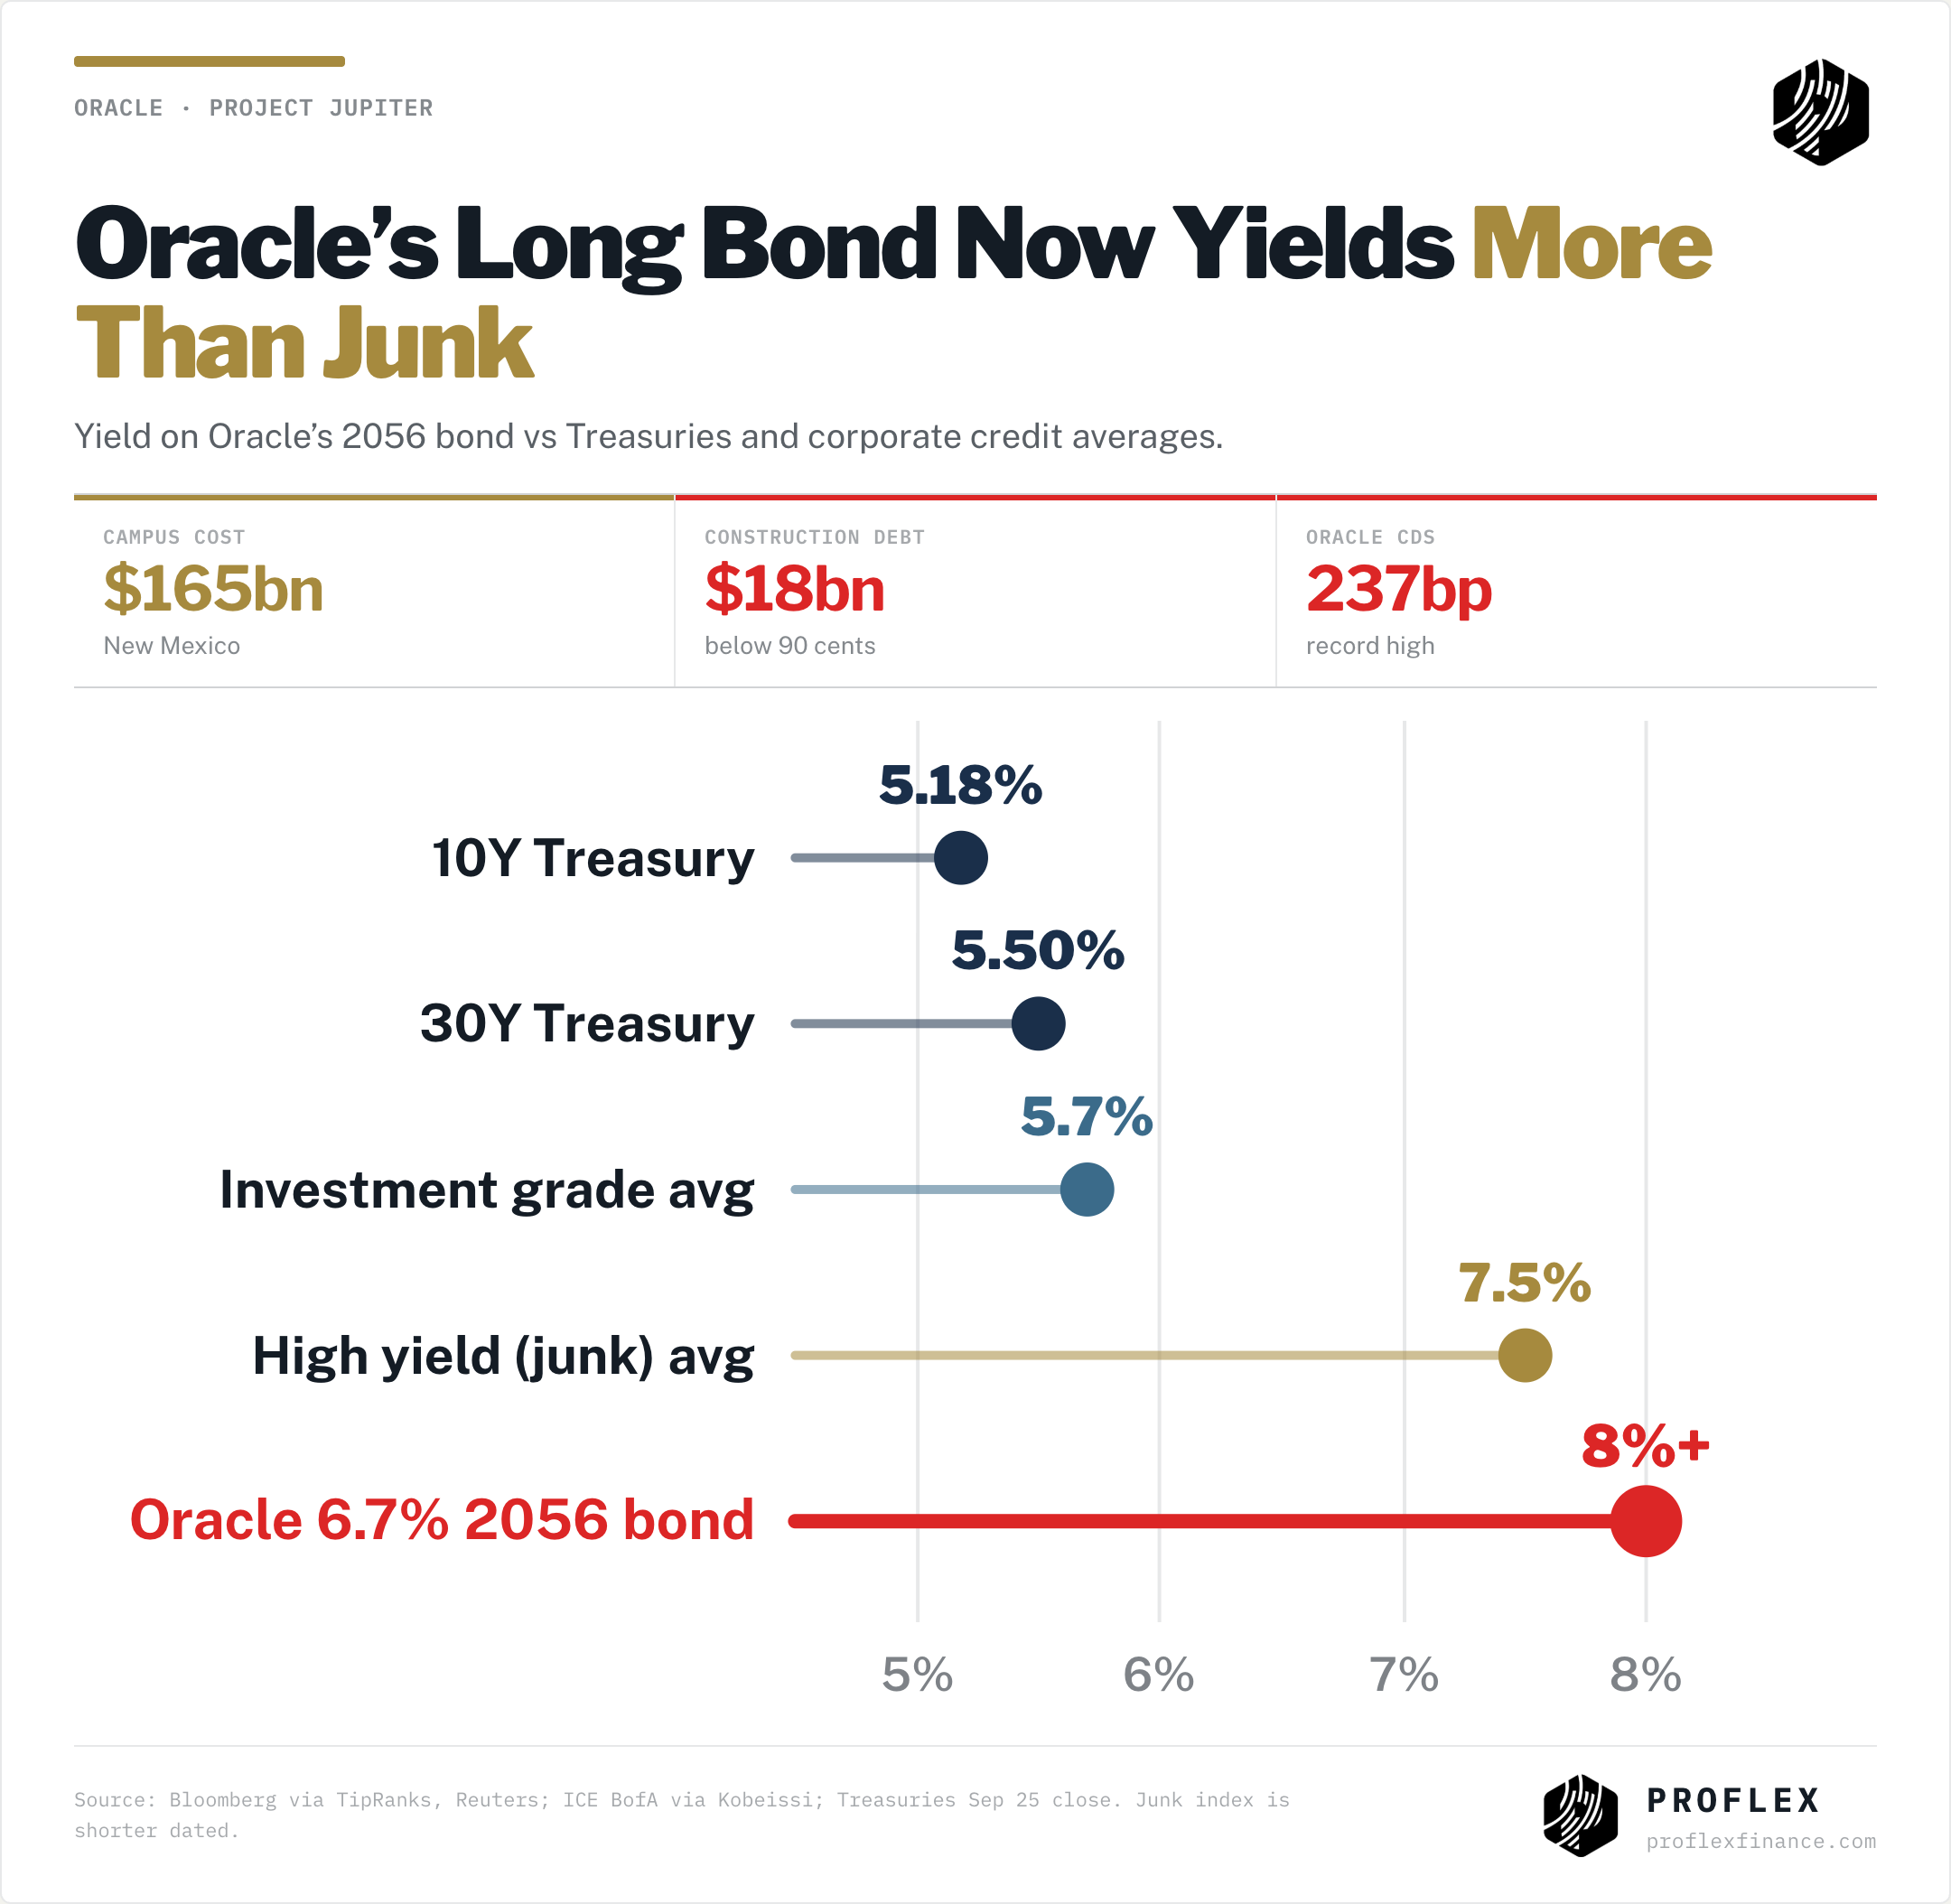
On September 24, Oracle sent Blue Owl a force majeure notice on Project Jupiter, its New Mexico data center. The notice lets Oracle delay rent if the site is not running by 2028. Oracle is still bound to pay the debt costs and cannot end the lease (Bloomberg, Reuters). The campus could cost up to $165 billion once built. Its $18 billion of construction loans trade below 90 cents on the dollar, Oracle’s 2056 bonds yielded above 8% for the first time, and the cost to insure its debt hit a record 237 basis points. Oracle fell 3.5% on Thursday. Blue Owl fell 3.6%.
Tap into real-time commentary from Proflex experts on market shifts, policy cycles, and global events—alongside daily discussions from 190+ Silicon Valley CTOs, CEOs, family offices, and seasoned HNIs.
Proflex View: This is the bear case in one company, and it is not a demand problem. Oracle has the backlog. What it cannot get is power, permits and delivery on time. The risk to the AI trade is not that nobody wants the capacity. It is that the capacity arrives late while the debt keeps accruing. Watch financing spreads on AI projects as closely as the stock prices.
🔍 What We’re Watching
Two weeks ago we named Brent at $120 as the trigger for a real correction. Brent settled at $104.32 on Friday, up 0.4% on the week, as hopes for a US and Iran deal grew
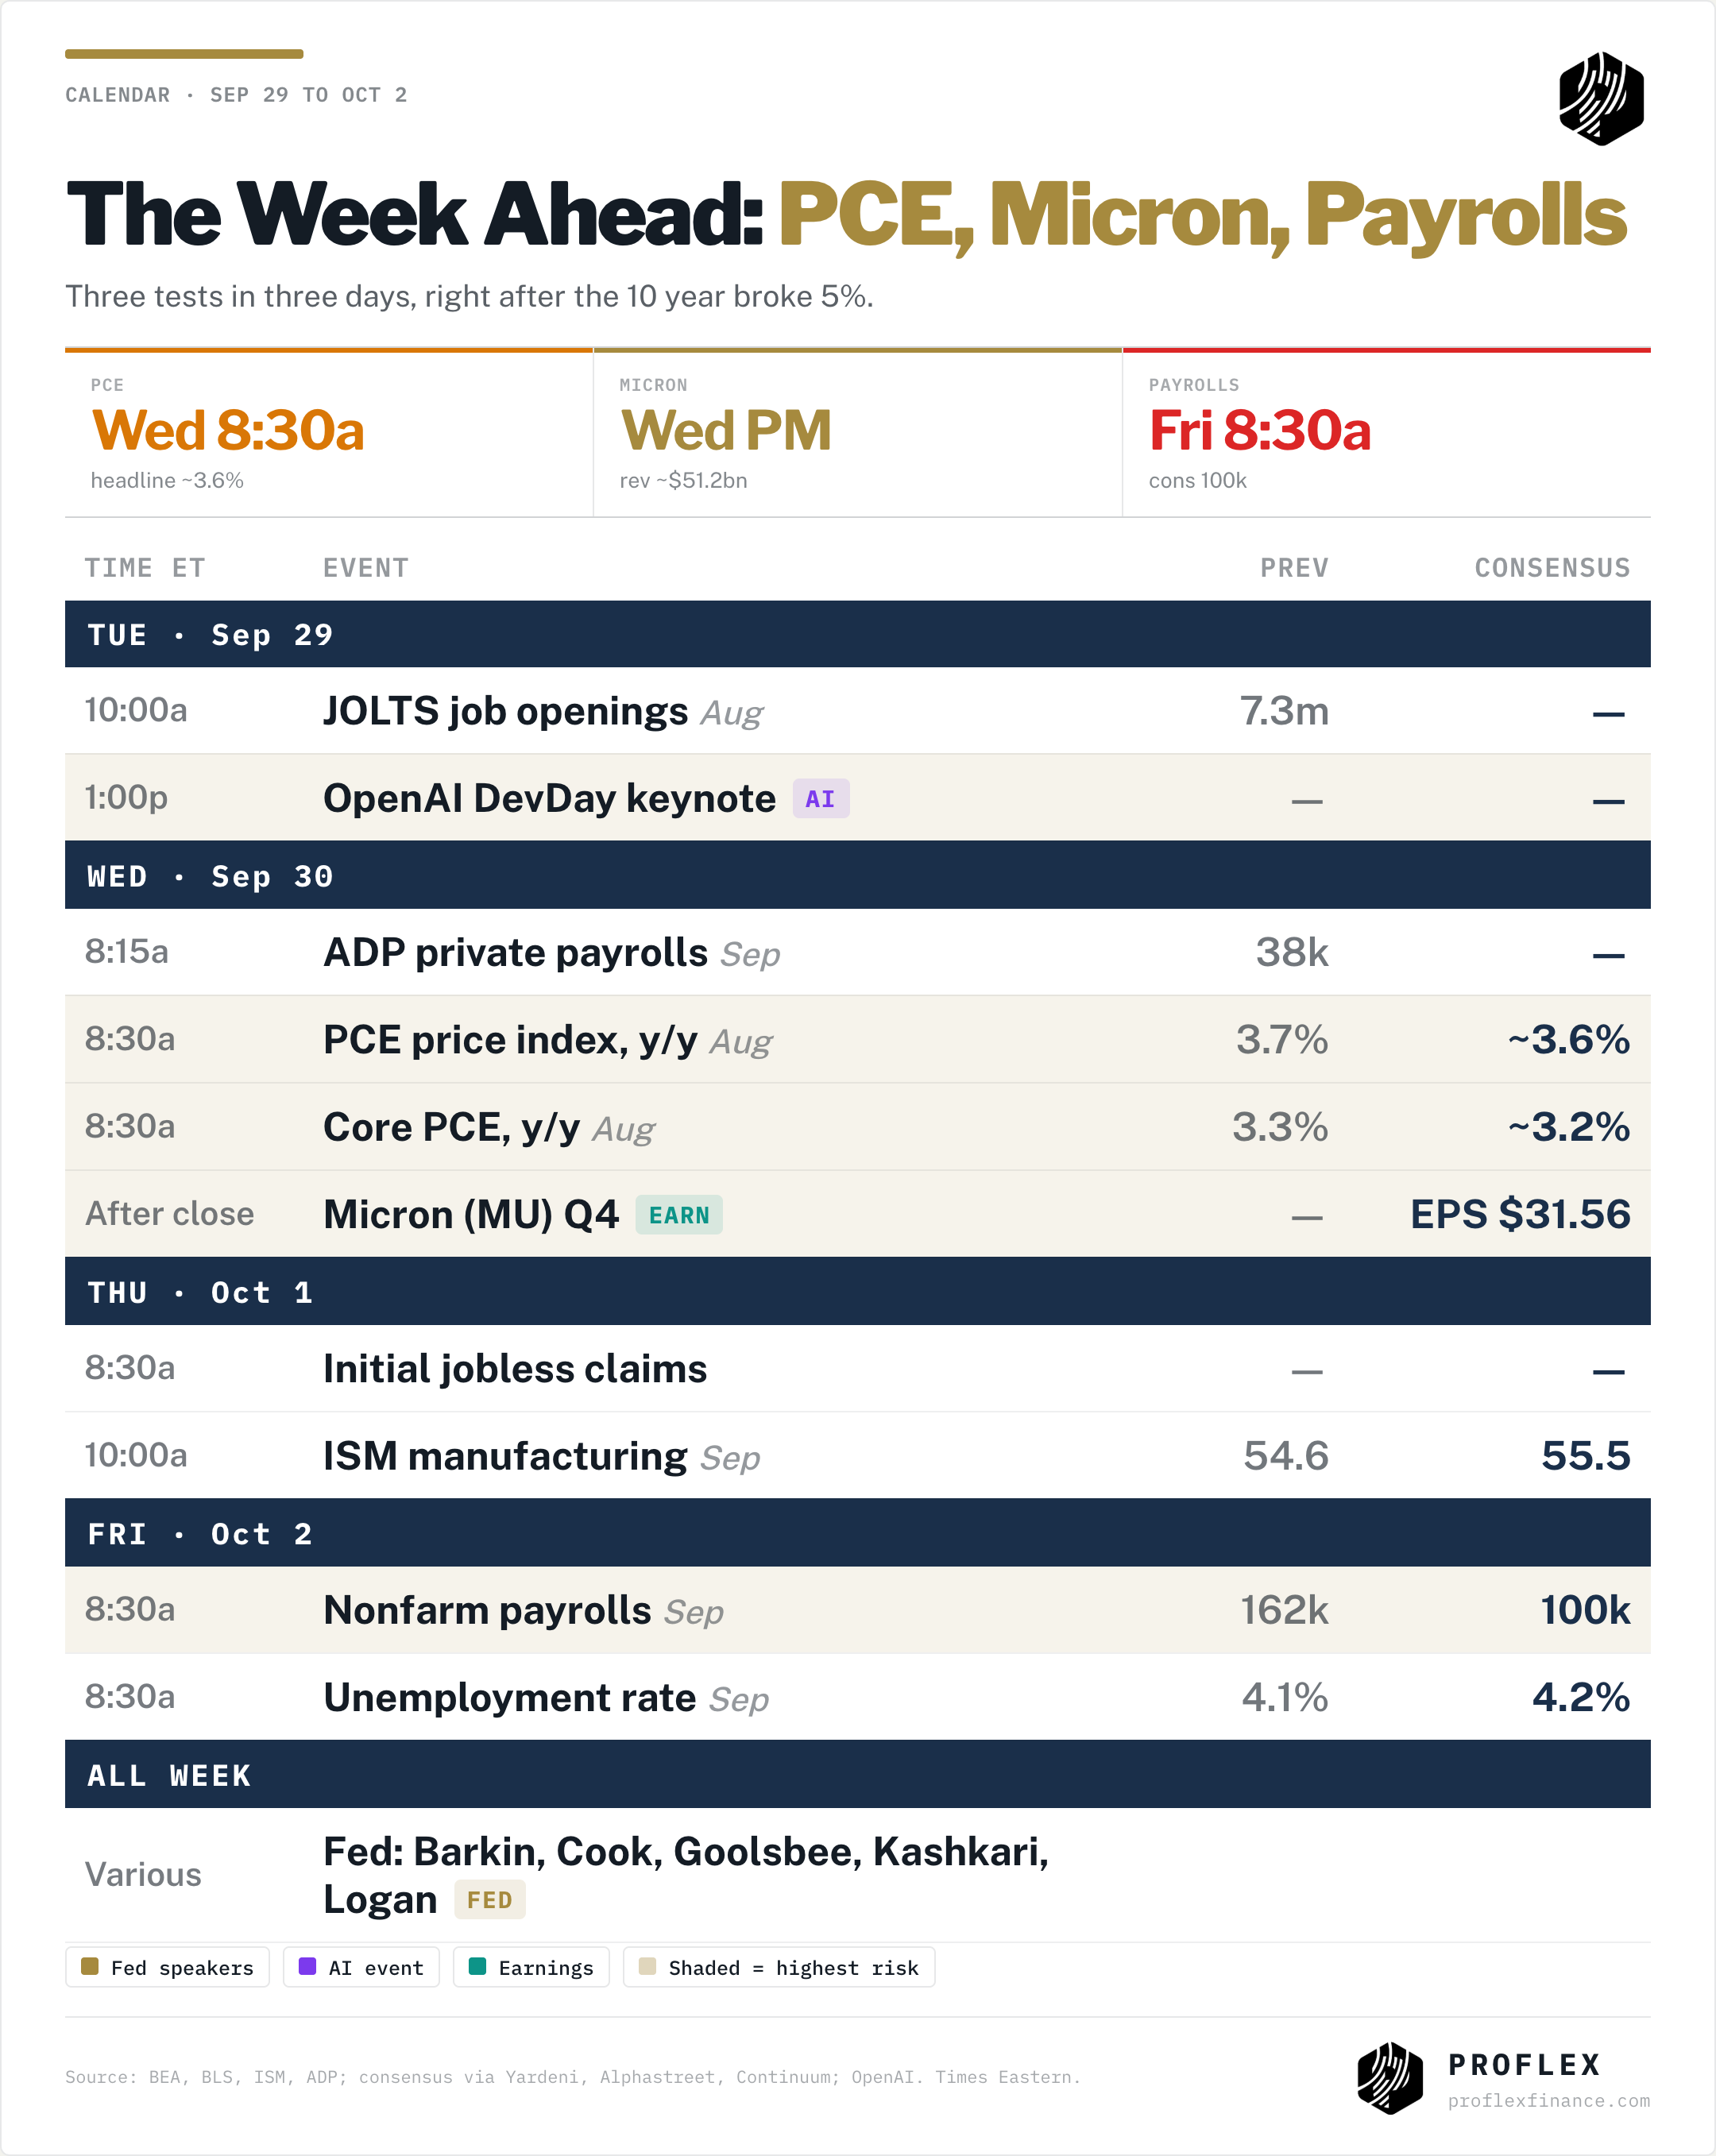
The 10 year against 5%, and whether PCE on Wednesday (headline forecast about 3.6% y/y, core about 3.2%) pushes October hike odds above 80%
Micron results on Wednesday: memory margins and the AI demand read through
The September jobs report on Friday: consensus 100,000, unemployment 4.2%
Whether the semiconductor ETF can hold above $600 and the laggards join in
OpenAI DevDay on Tuesday and the start of Q3 bank earnings in about two weeks
🧭 Proflex Playbook – Own the Payoff, Respect the Cost of Money A 5% 10 year is a real cost of capital, and it punishes the businesses that need cheap money to deliver. Stay with the AI leaders that already have the users and the cash flow, add to the discounted leaders as they join in, and be selective with anything that depends on debt to get capacity built on time. Our conviction stays anchored in the data:
Focus on Structural Growth: Continue to overweight the secular AI theme, recognizing its multi-year runway.
Anticipate Shallow Corrections: Use dips as accumulation opportunities, not reasons for fear, understanding that "none of the corrections stick."
Diversify Thoughtfully: Recognize the "decorrelation" across asset classes; consider gold, silver and Bitcoin for portfolio resilience.
Develop Mental Models: Prioritize long-term planning (6-12 months out) over short-term news, aiming for consistent, incremental gains.
If you're an All-Access or Managed Portfolio subscriber, our positioning has already shifted ahead of this moment—scaling up asymmetric hard asset plays while hedging for earnings volatility and geopolitical tail risks.
Proflex All-Access: Your Market Compass
Explore the financial markets with Proflex All-Access, your comprehensive resource for deeper market understanding and active participation. This premium service offers subscribers exclusive insights and actionable investment advice, giving you a significant edge in various market conditions.
Proflex All-Access provides detailed analyses and recommendations to optimize your investment strategy. Our specialized newsletters include:
• Growth Gazette (Contains Crypto Pulse) : Aimed at achieving above-market returns for aggressive portfolio growth.
• Income Insider: Focused on conservative strategies and income generation for yield-seeking investors.
Until next week, — The Proflex Team Trusted Macro Insights. Calm Investing. Tactical Trades.
Elevate your financial IQ
ProFlex® by Proflex Finance Legal Disclosures
ProFlex® by Proflex Finance, the premium newsletter product series, provides informational and educational content only and does not offer personalized investment advice or establish a fiduciary relationship. While we rely on reliable sources and research, the information is not tailored to individual financial situations. Readers are urged to consult qualified financial professionals before making investment decisions. We do not guarantee the accuracy, completeness, or timeliness of the information and are not responsible for any investment decisions based on this newsletter. Investing carries risks, and past performance doesn't predict future results. By accessing this newsletter, you acknowledge that we are not liable for actions or decisions resulting from its content. Please conduct due diligence and seek professional advice as needed.
Frequently Asked Questions
Sector rotation signals include divergence between growth and value indices, relative strength shifts in sector ETFs, credit spread movements, and changes in the yield curve. When defensive sectors outperform cyclicals, it often signals risk-off positioning. Monitoring small-cap (Russell 2000) relative to large-cap performance provides insight into economic confidence and risk appetite.
Options expiration (especially quarterly "triple witching") can create significant short-term volatility as dealers unwind hedging positions. Gamma exposure determines whether dealer hedging amplifies or dampens moves. Negative gamma environments can accelerate selloffs, while positive gamma tends to suppress volatility. Large open interest strikes often act as price magnets into expiry.
Federal Reserve rate decisions directly influence borrowing costs, corporate earnings, and investor sentiment. Rate cuts typically boost equities by lowering discount rates and encouraging risk-taking, while rate hikes can compress valuations. The market often prices in expected moves weeks in advance, so the surprise element and forward guidance matter more than the decision itself.
Earnings reports reveal actual business performance versus market expectations. Revenue growth, profit margins, and forward guidance drive stock re-ratings. Beats or misses relative to consensus estimates move individual stocks and can shift sector-wide sentiment. Earnings season also provides insight into broader economic health and consumer spending trends.
Treasury yields serve as the risk-free rate against which all assets are priced. Rising yields increase the discount rate applied to future cash flows, compressing growth stock valuations. They also make bonds more competitive with equities for yield-seeking investors. The yield curve shape (normal, flat, inverted) provides signals about economic growth expectations and recession probability.