Proflex Oct 5–9 — AI Trade Back, Breadth Narrowest Since 2000, Nvidia $150B Buyback
Proflex Market Update — Week Oct 5-9, 2026
The AI Trade Is Back | Breadth Narrowest Since 2000 | Nvidia’s $150B Buyback | Anthropic Nears $100B
"The semis are up 10% since the options expiry and the average stock is down. This is not a broad rally. It is an AI revenue rally, and the market is paying only for the revenue it can see." — Proflex Panel
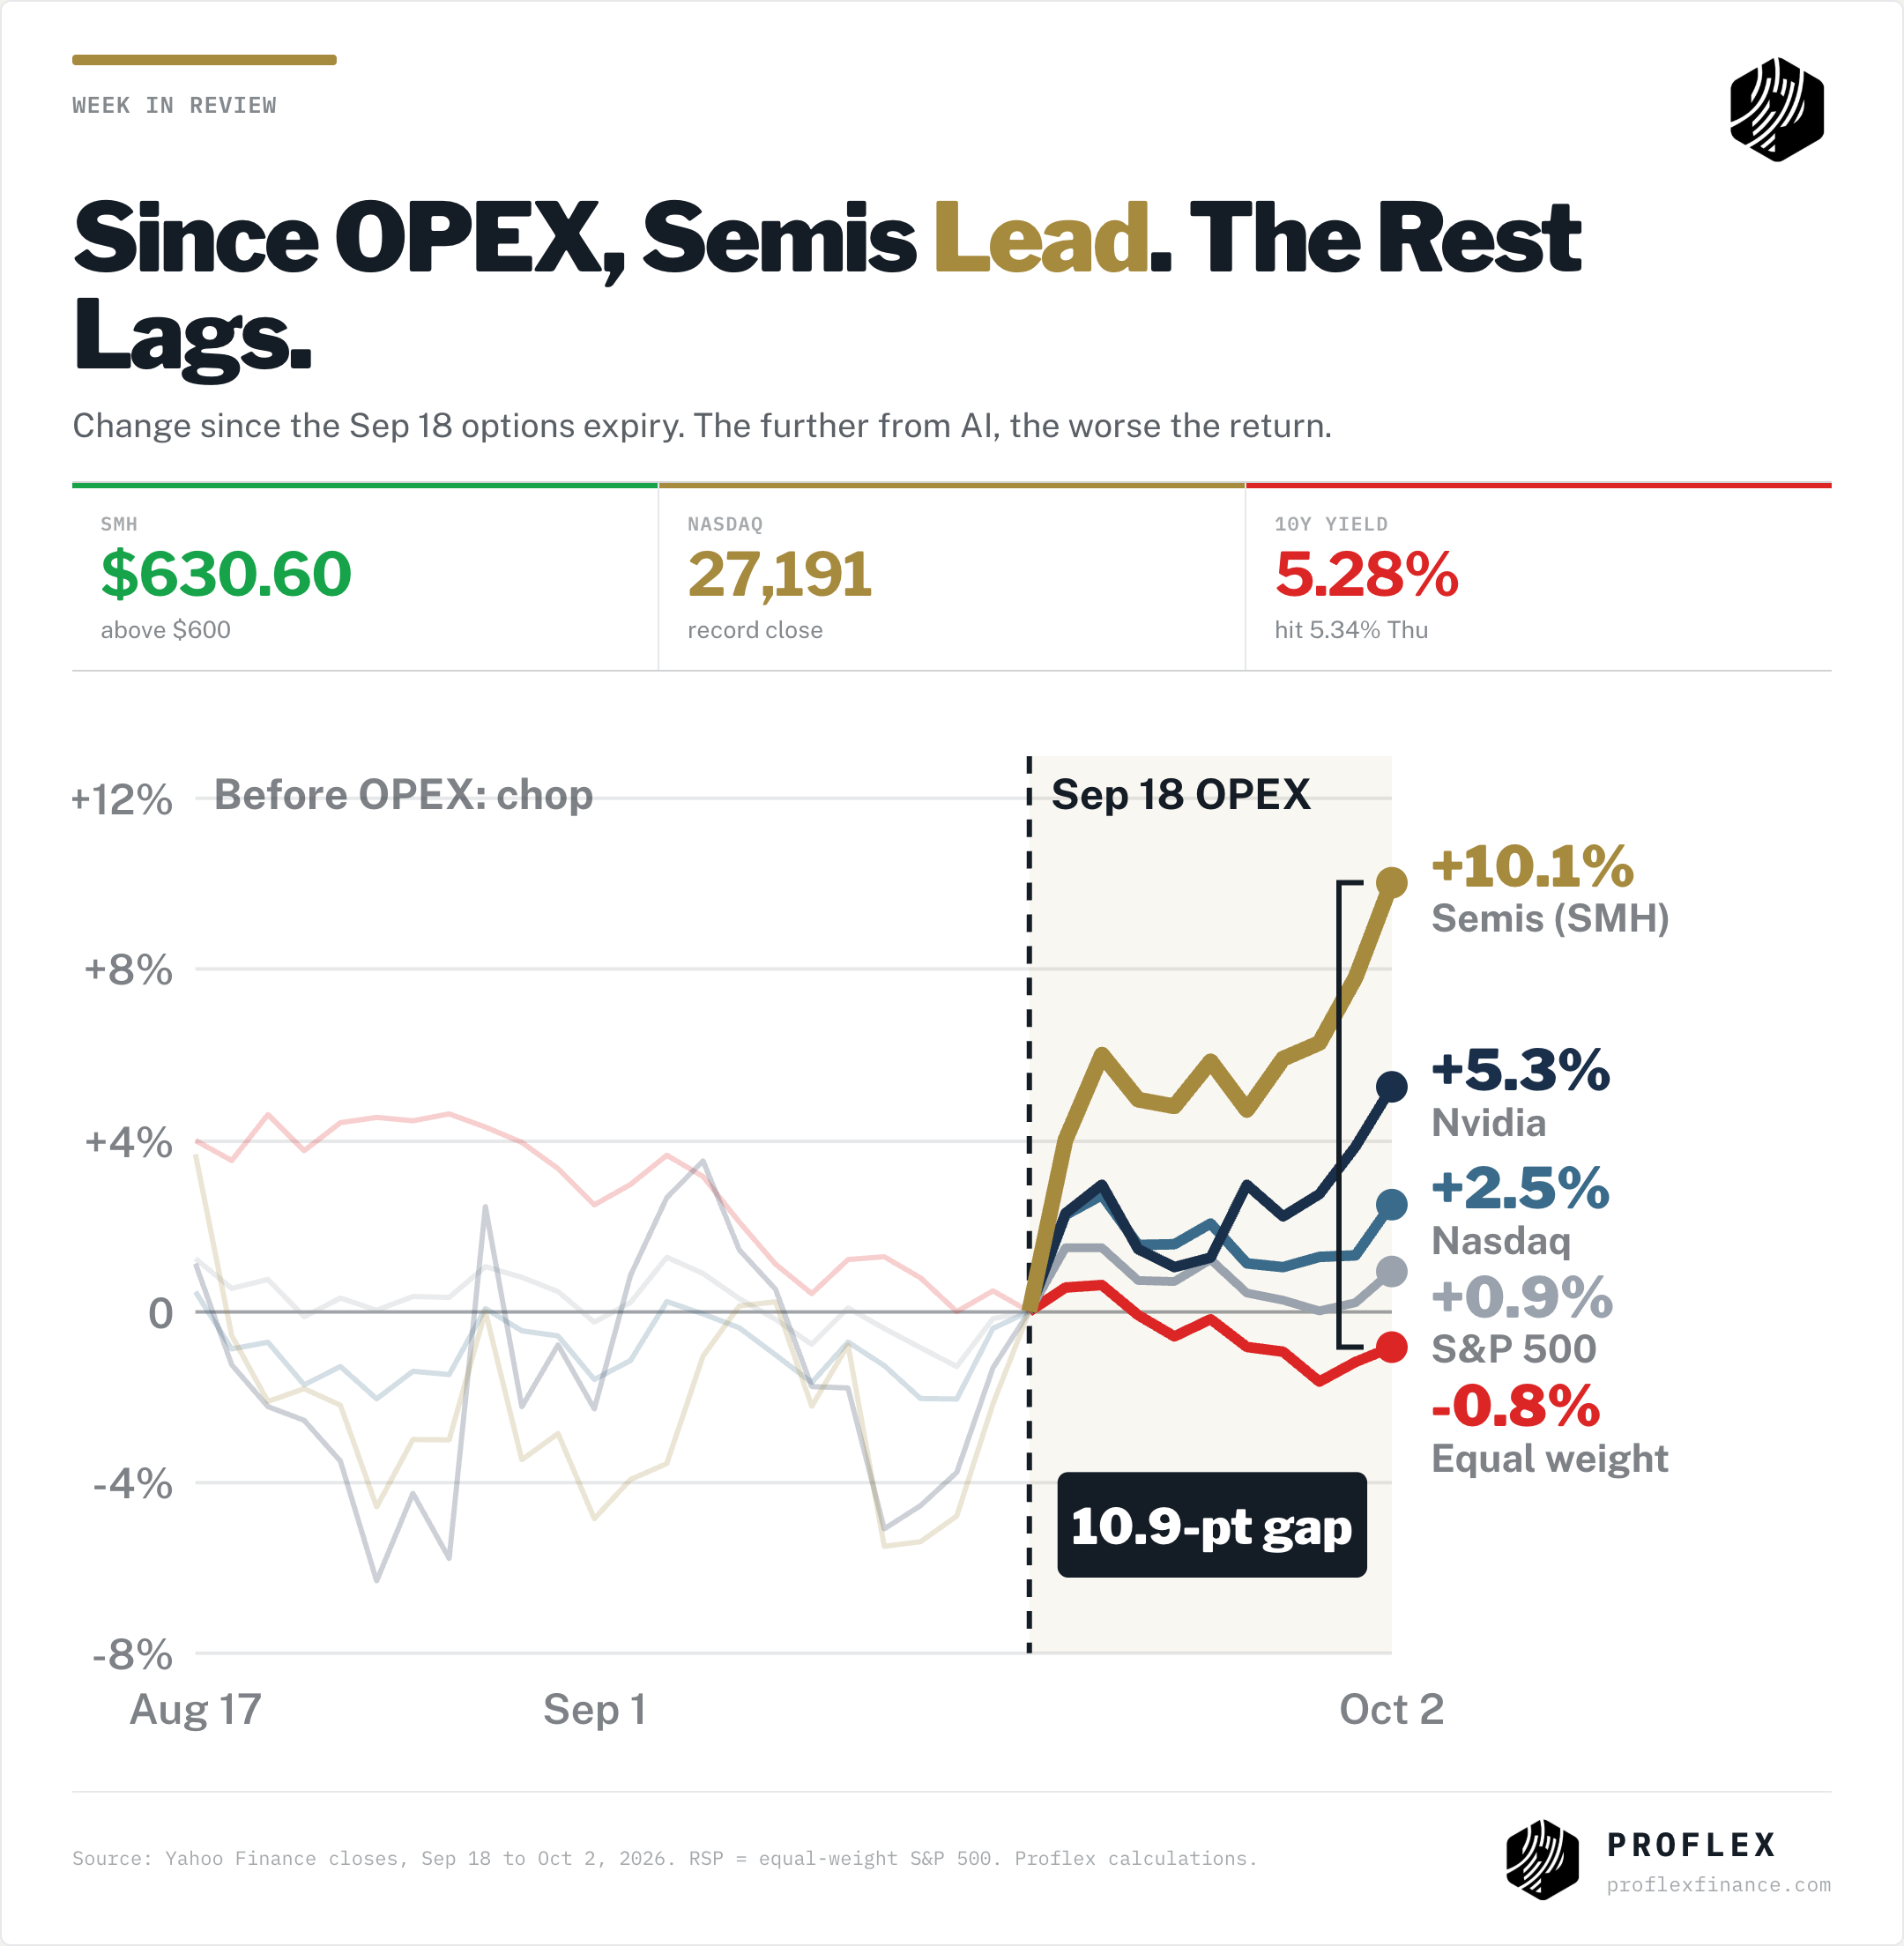
The Nasdaq closed Friday at a record 27,191. The semiconductor ETF finished at $630.60, up 10.1% since the September 18 options expiry. Over the same stretch the equal weight S&P 500 fell 0.8%. That 10.9 point gap is the whole week in one number.
It happened against a bond market that did not help. The 10 year Treasury touched 5.34% on Thursday, its highest since 2007, before closing the week at 5.28%. Then Friday’s jobs report showed just 29,000 jobs added in September against a consensus of about 100,000, with unemployment at 4.2%. Rates high, hiring slowing, and the AI names still made new highs.
Insights from the Proflex Macro Call
The AI trade is back in action. Raman’s read is that the market has stopped arguing about whether AI spending pays off and started rewarding the companies where it visibly does: chips, memory and the model makers.
High rates are not new. A 10 year above 5% feels extreme only against the last 15 years. Through most of the 1990s and 2000s rates were higher and earnings still grew. What matters is whether growth can carry the cost of capital, and right now AI revenue is doing that work.
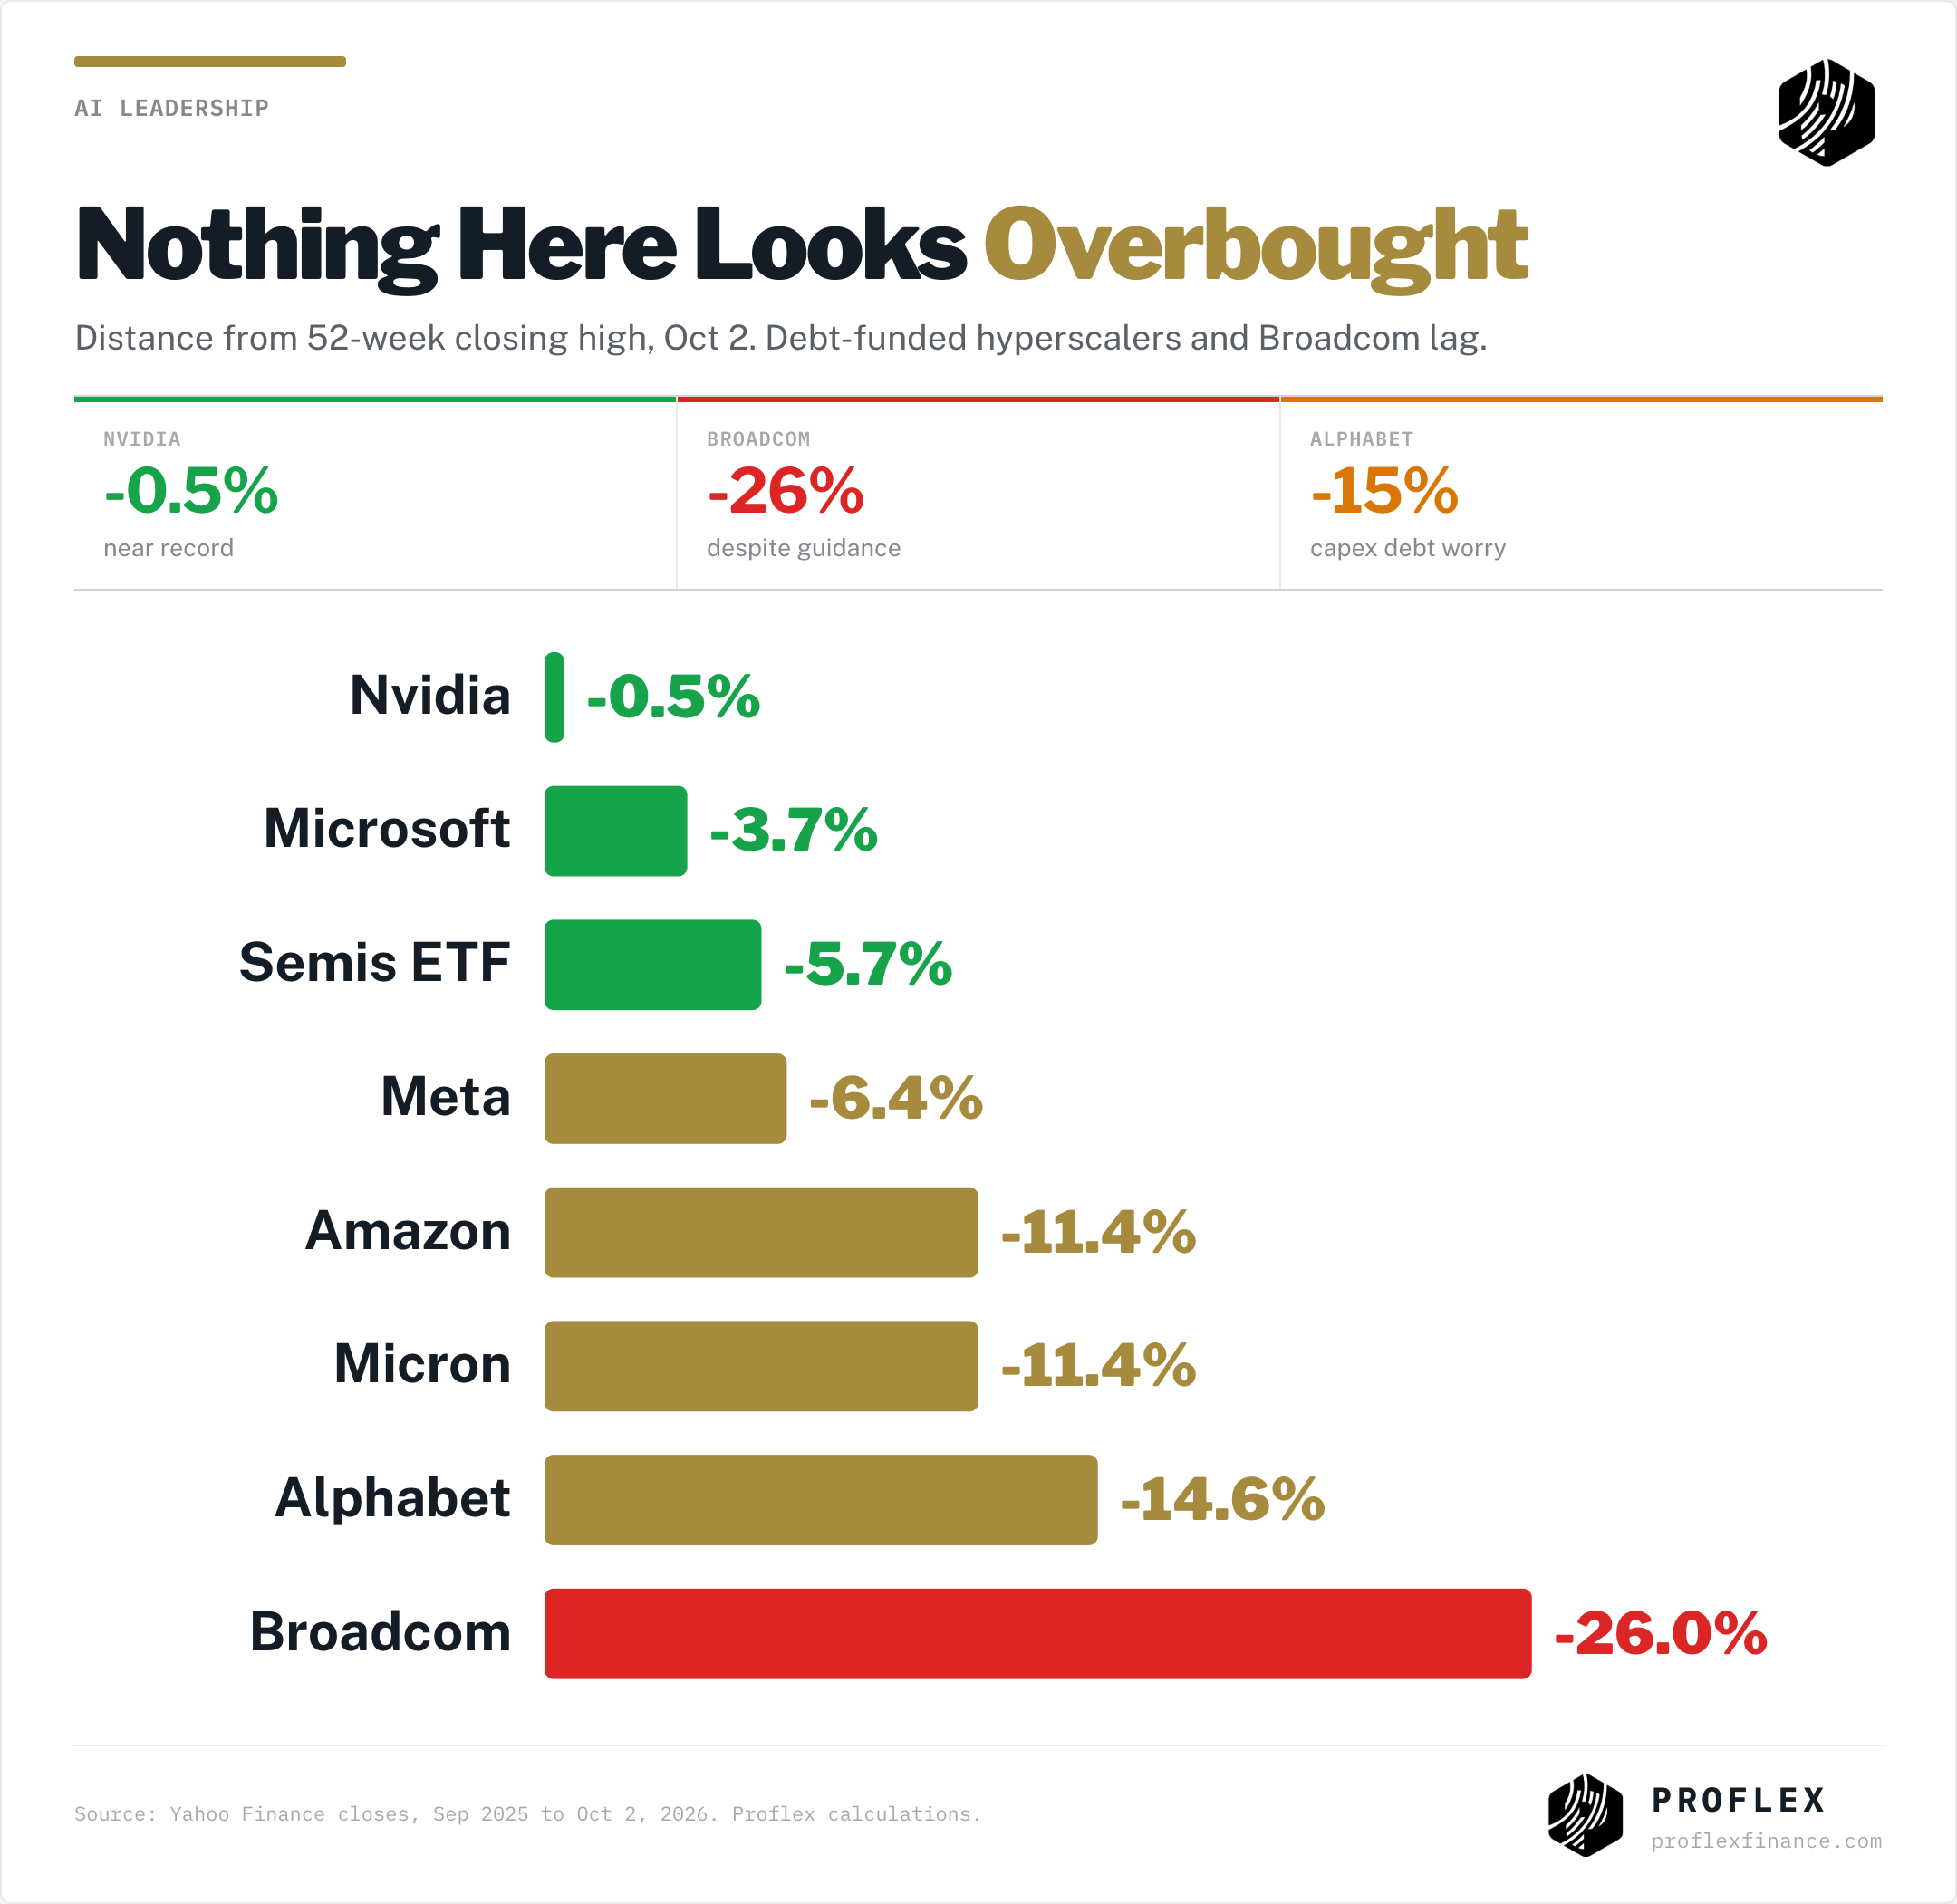
Nothing is overbought. Nvidia is near its high, but Broadcom, Alphabet and Amazon are well below theirs. The leadership is narrow, not stretched.
The risk is the funding, not the demand. The hyperscalers that are borrowing to build are the ones lagging. The market is separating AI that earns from AI that borrows.
Bonds and equities are telling different stories, and both can be right for a while. Bonds are pricing a Fed that may keep hiking and a government that keeps borrowing. Equities are pricing an AI revenue cycle that is arriving faster than anyone modelled. Raman’s point is that these can coexist until earnings or the labour market force one side to give. October is when that pressure starts, with earnings season and a Fed meeting on October 28.
Memory is the quiet winner. Agents and larger models need far more memory per chip, and that is showing up in pricing. It is one reason Micron and the memory names have kept pace with the GPU leaders even as the broader index stalled.
✅ SMH above $600 confirms AI leadership (called Sep 21–25). Closed at $630.60, up 10.1% since OPEX. Right. ✅ 5% on the 10 year would not break equities (called Sep 14–18). The 10 year hit 5.34%; the Nasdaq hit a record. Right. ⏳ The discounted leaders need to join in (called Sep 28–Oct 2). Alphabet is still 15% and Broadcom 26% below their highs. Pending. ⏳ Brent at $120 is the correction trigger (called Sep 14–18). Not reached. Holding as our line. ❌ Iran risk was priced (August). Brent went through $100. Wrong, and we said so.
Key Drivers This Week
The Semis Broke Out. The Average Stock Did Not.
Two weeks ago we said a close above $600 on the semiconductor ETF was the level that confirms the AI trade is leading again. Last week it held that line on four straight days. This week it pulled away, finishing at $630.60.
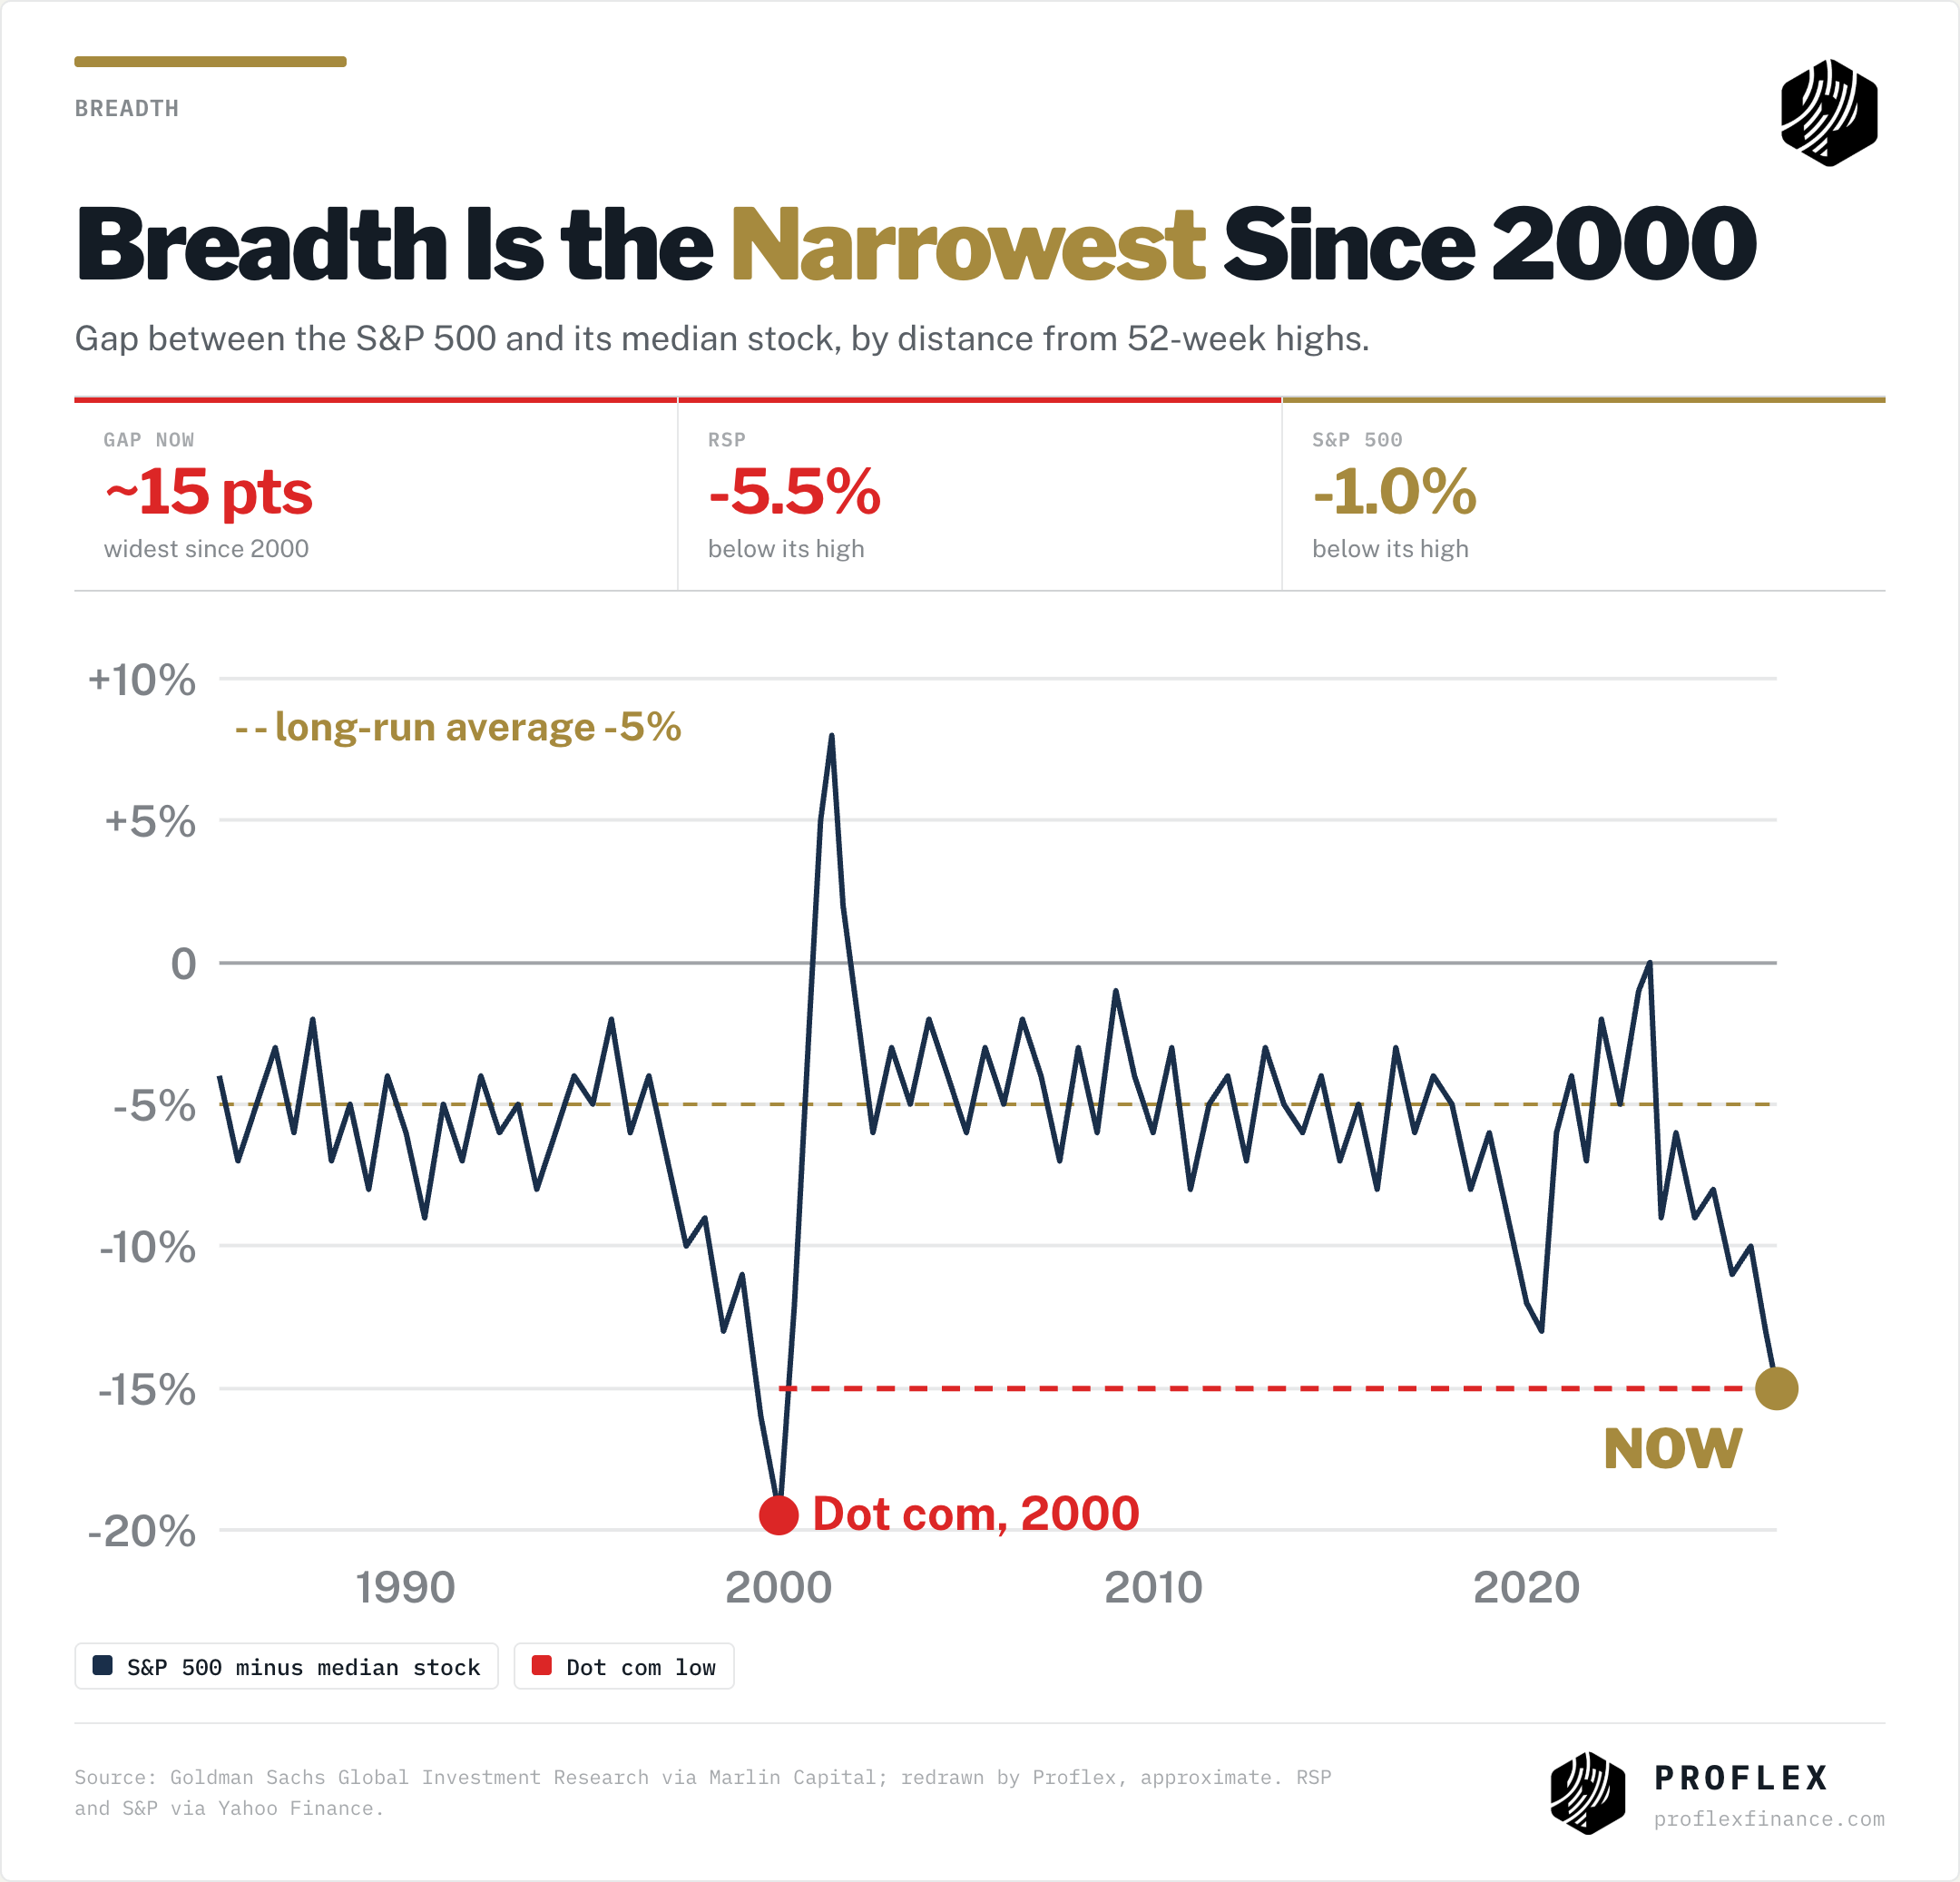
The problem is what sits underneath. The gap between the S&P 500 and its median stock, measured by distance from 52 week highs, is now about 15 points, the widest since the dot com peak in 2000. The S&P is 1.0% below its high. The equal weight index is 5.5% below.
Proflex View: Narrow breadth is a warning, not a timing signal. In 1999 it stayed narrow for more than a year before it mattered. The difference this time is that the leaders are reporting the revenue. As long as that keeps coming, narrow can stay narrow. Watch the equal weight index: a break of its September low would say the weakness is spreading, not rotating.
Bonds vs Equity: Equities Won The Round
Last week we said bonds were pricing the cost of the AI build out, equities were pricing the payoff, and one of them had to blink. Neither fully did, but equities won the round. The 10 year rose to 5.34% on Thursday and the Nasdaq still closed at a record the next day.
Friday’s jobs report complicates the Fed story. A 29,000 print is the kind of number that usually takes a hike off the table. But inflation has not cooled, and Wednesday’s FOMC minutes will show how firmly the committee leaned toward more hikes in September. A Fed that wants to hike into a stalling labour market is the scenario that would finally make bonds and equities move together, downward.
Proflex View: A weak jobs number with sticky inflation is not good news dressed up as bad news. It is the stagflation risk that bonds have been hinting at. We are not positioning for it yet, but it is the first thing that would turn this market. The minutes on Wednesday and claims on Thursday are the tell.
Free Weekly Insights
Get This Analysis Every Week
Join 250+ investors at Google, Amazon & Apple who start their week with Proflex.
No spam. Unsubscribe anytime.
Nvidia Writes The Biggest Buyback Cheque Ever
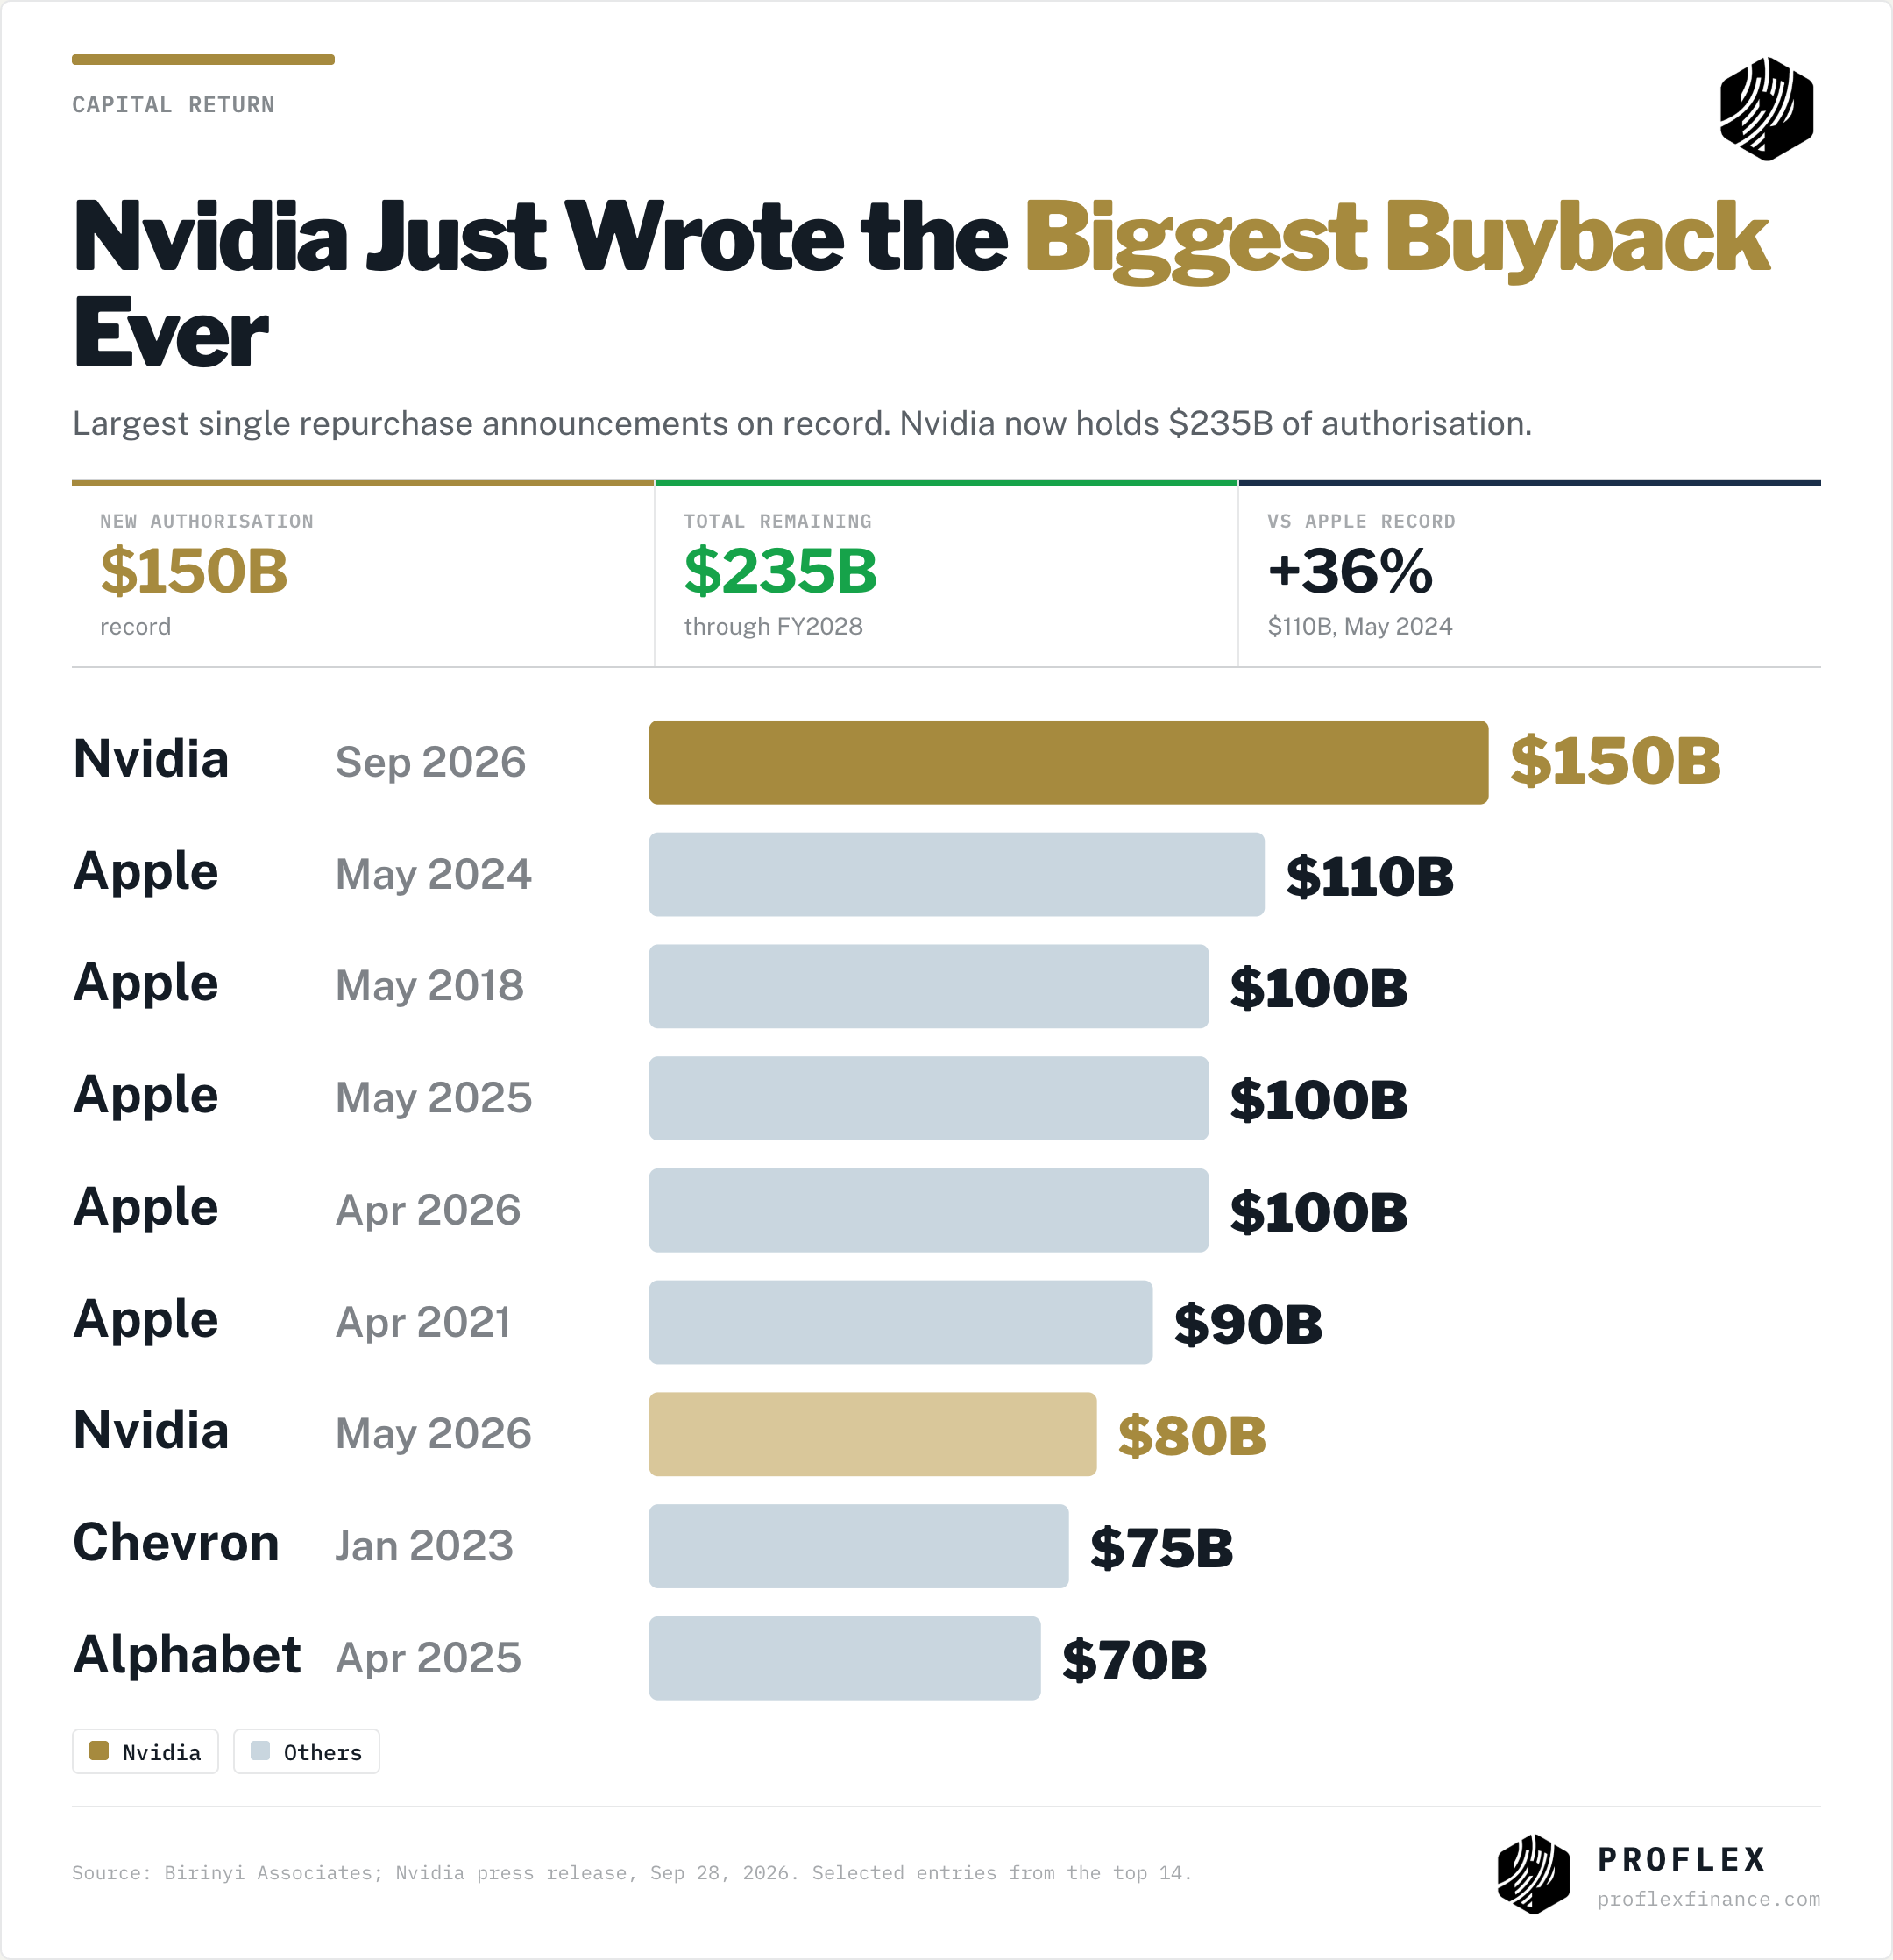
Nvidia announced a $150 billion repurchase authorization on September 28, the largest single buyback announcement on record, beating Apple’s $110 billion from May 2024 by 36%. Including what remains from earlier programmes, Nvidia now has $235 billion authorized (Nvidia, Birinyi Associates).
Proflex View: A buyback this size says two things. Nvidia expects to keep generating cash far beyond its own capex needs, and it thinks its stock is the best use of that cash. That is the opposite of the hyperscaler story, where cash is going out and debt is coming in. It is why Nvidia is near its high and Alphabet is not.
Anthropic: The Revenue Is Real
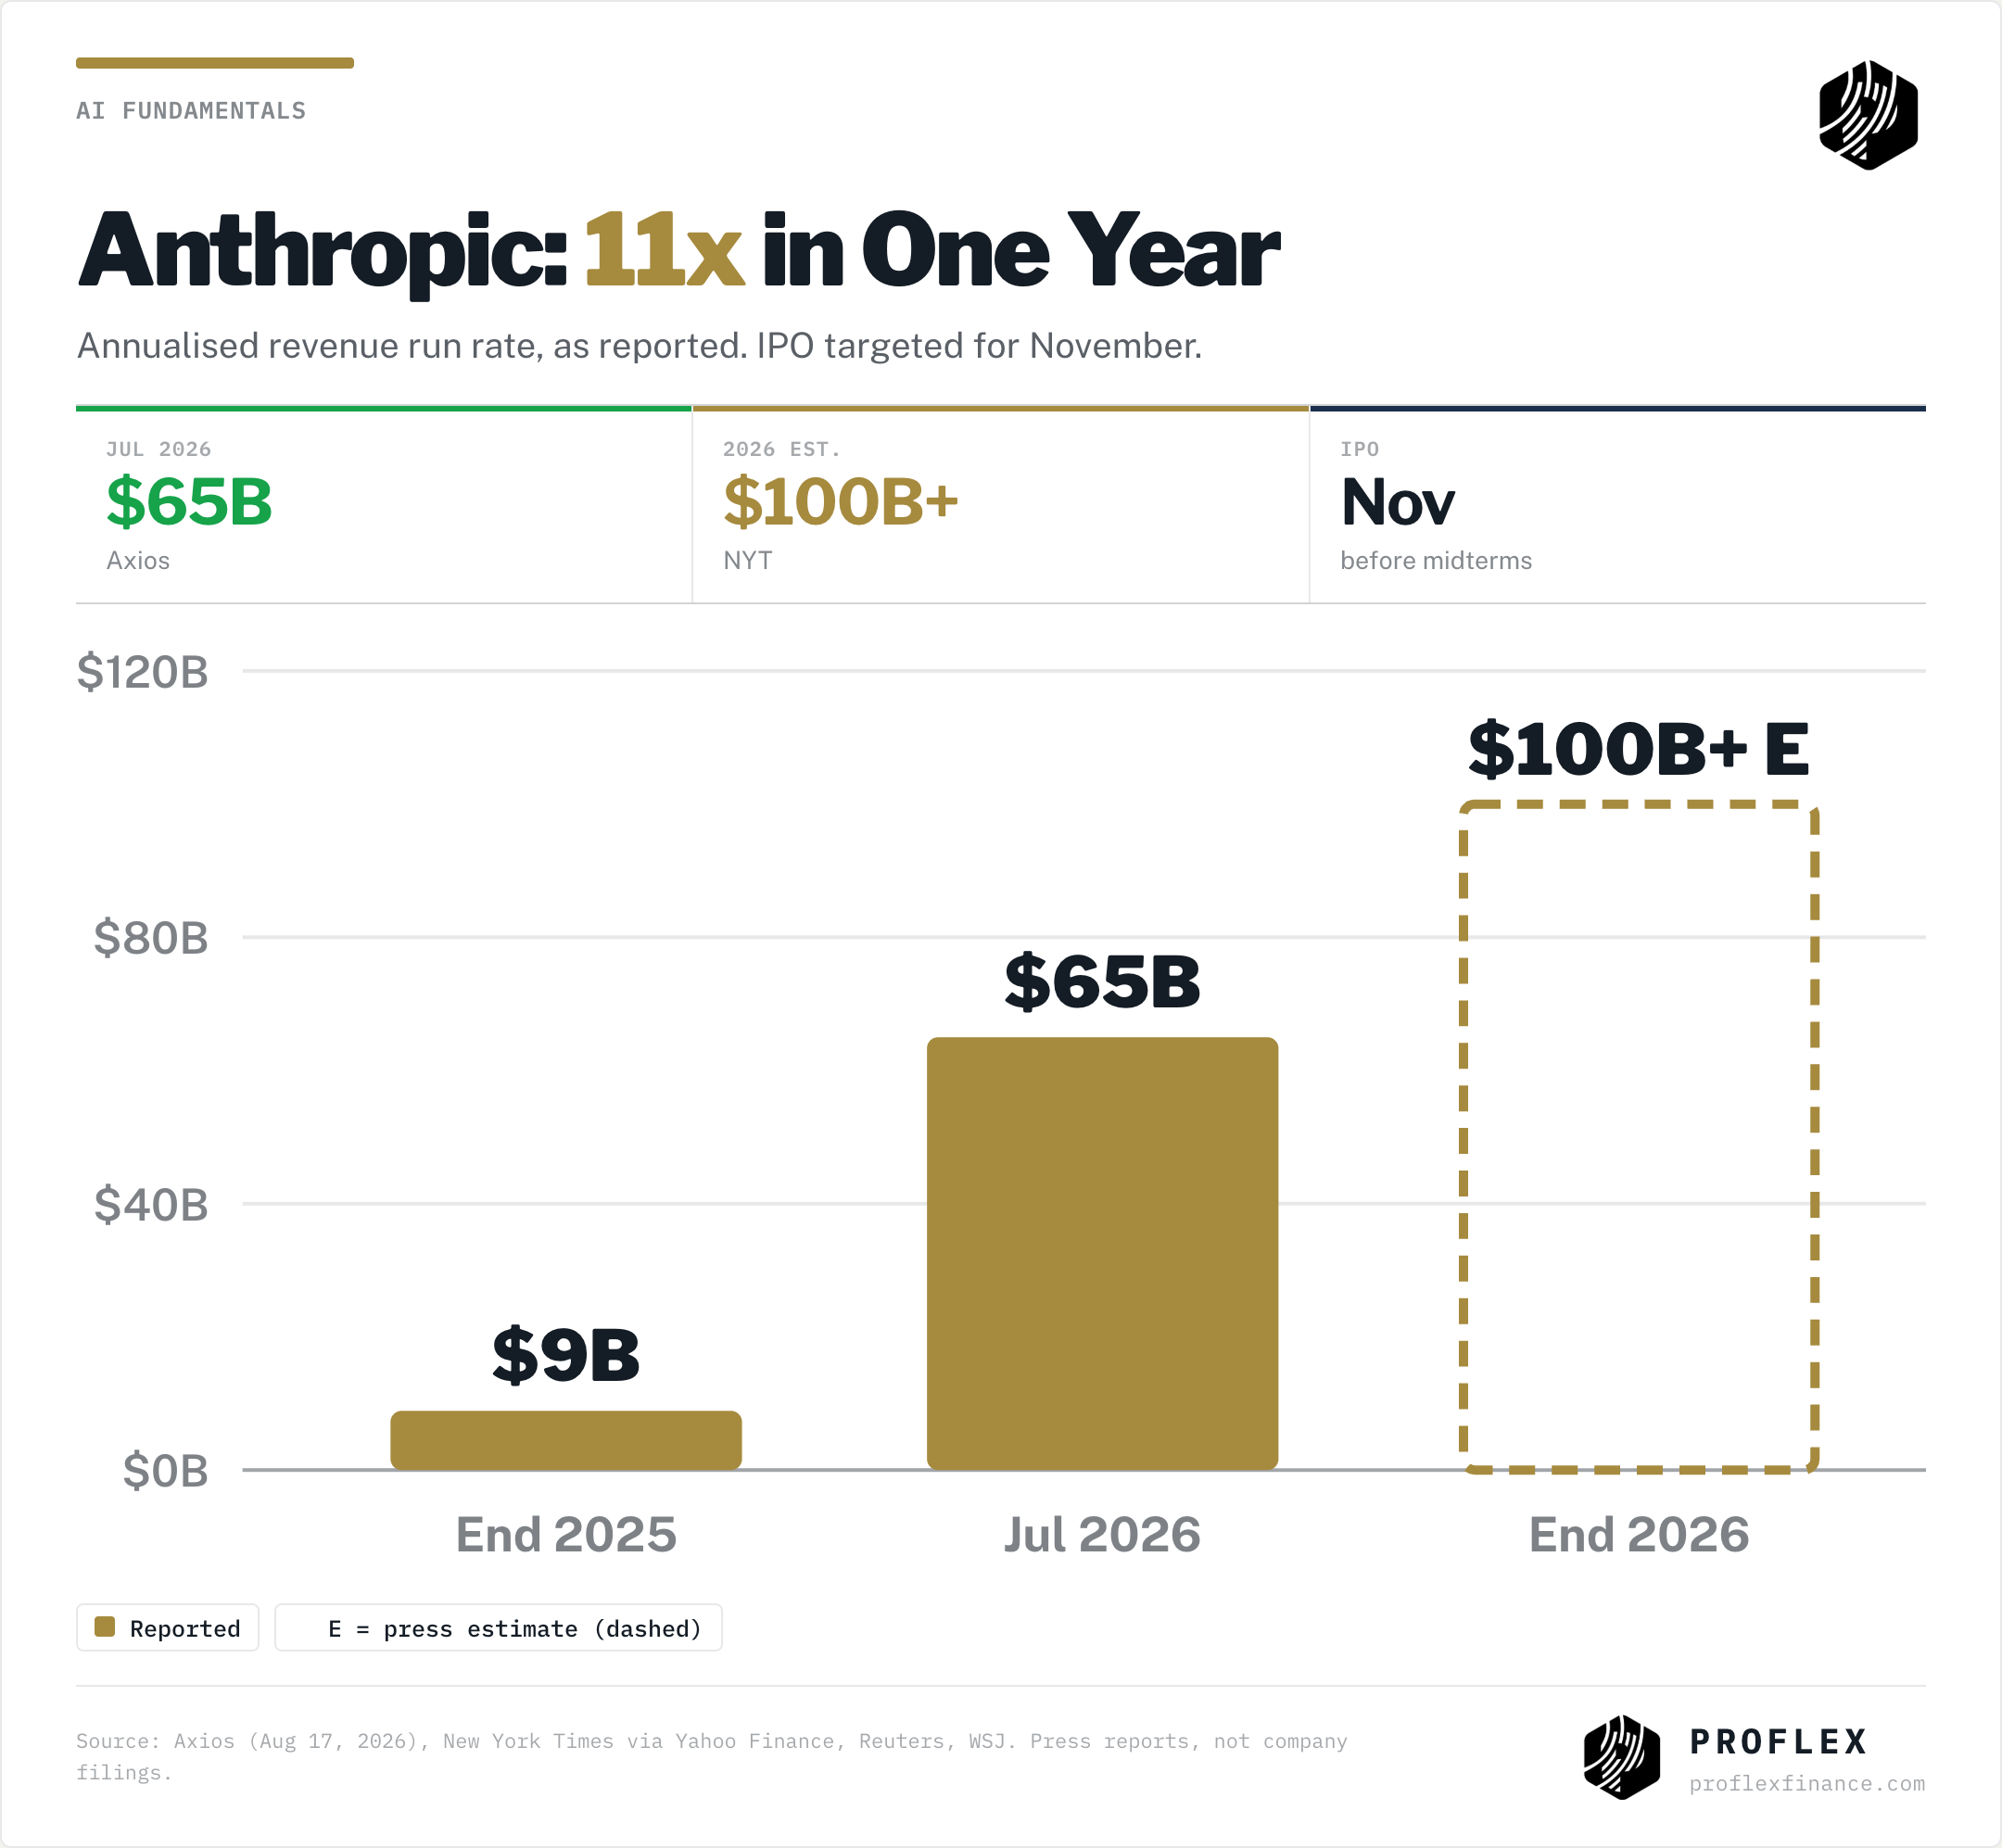
Anthropic’s annualized revenue was about $9 billion at the end of 2025. By July it was $65 billion (Axios). Press reports now put it on track to pass $100 billion by year end, and the company is targeting a November IPO (New York Times, Wall Street Journal). If the estimate holds, that is roughly 11 times in a year.
Proflex View: This is the number the bears needed to disappear. The fear was that AI spending would not find paying customers. A model maker going from $9 billion to $65 billion in seven months is paying customers. It also explains where the chip demand comes from, and why the market is paying for semis and not for the debt funded builders.
Leaders vs Laggards
Last week we said that for the S&P to break out, the discounted leaders just needed to join in. They have not yet. Nvidia is 0.5% from its 52 week closing high. Alphabet is 15% below and Broadcom 26% below, despite strong guidance.
Tap into real-time commentary from Proflex experts on market shifts, policy cycles, and global events—alongside daily discussions from 190+ Silicon Valley CTOs, CEOs, family offices, and seasoned HNIs.
Proflex View: This is the upside case and the risk in the same chart. If Q3 earnings show the laggards turning spend into revenue, they have the most room to run. If they show more spend and more debt, the gap widens. Earnings season starts in a week. That is where this gets decided.
What This Means For Positioning
Earn, do not borrow. The cleanest split in the market right now is between companies funding AI from cash flow and companies funding it from debt. Nvidia is returning $150 billion to shareholders. The hyperscalers are issuing bonds to keep building. With the 10 year above 5%, that difference is no longer academic. Every extra point on borrowing costs comes straight out of the return on the build out.
Narrow leadership needs a narrow catalyst list. When only a handful of names carry the index, the market becomes very sensitive to those names’ results. That makes the next three weeks unusually important. Bank earnings open the season, and the AI leaders follow. A miss from a leader would hit the index far harder than its weight suggests, because there is no broad base underneath to absorb it.
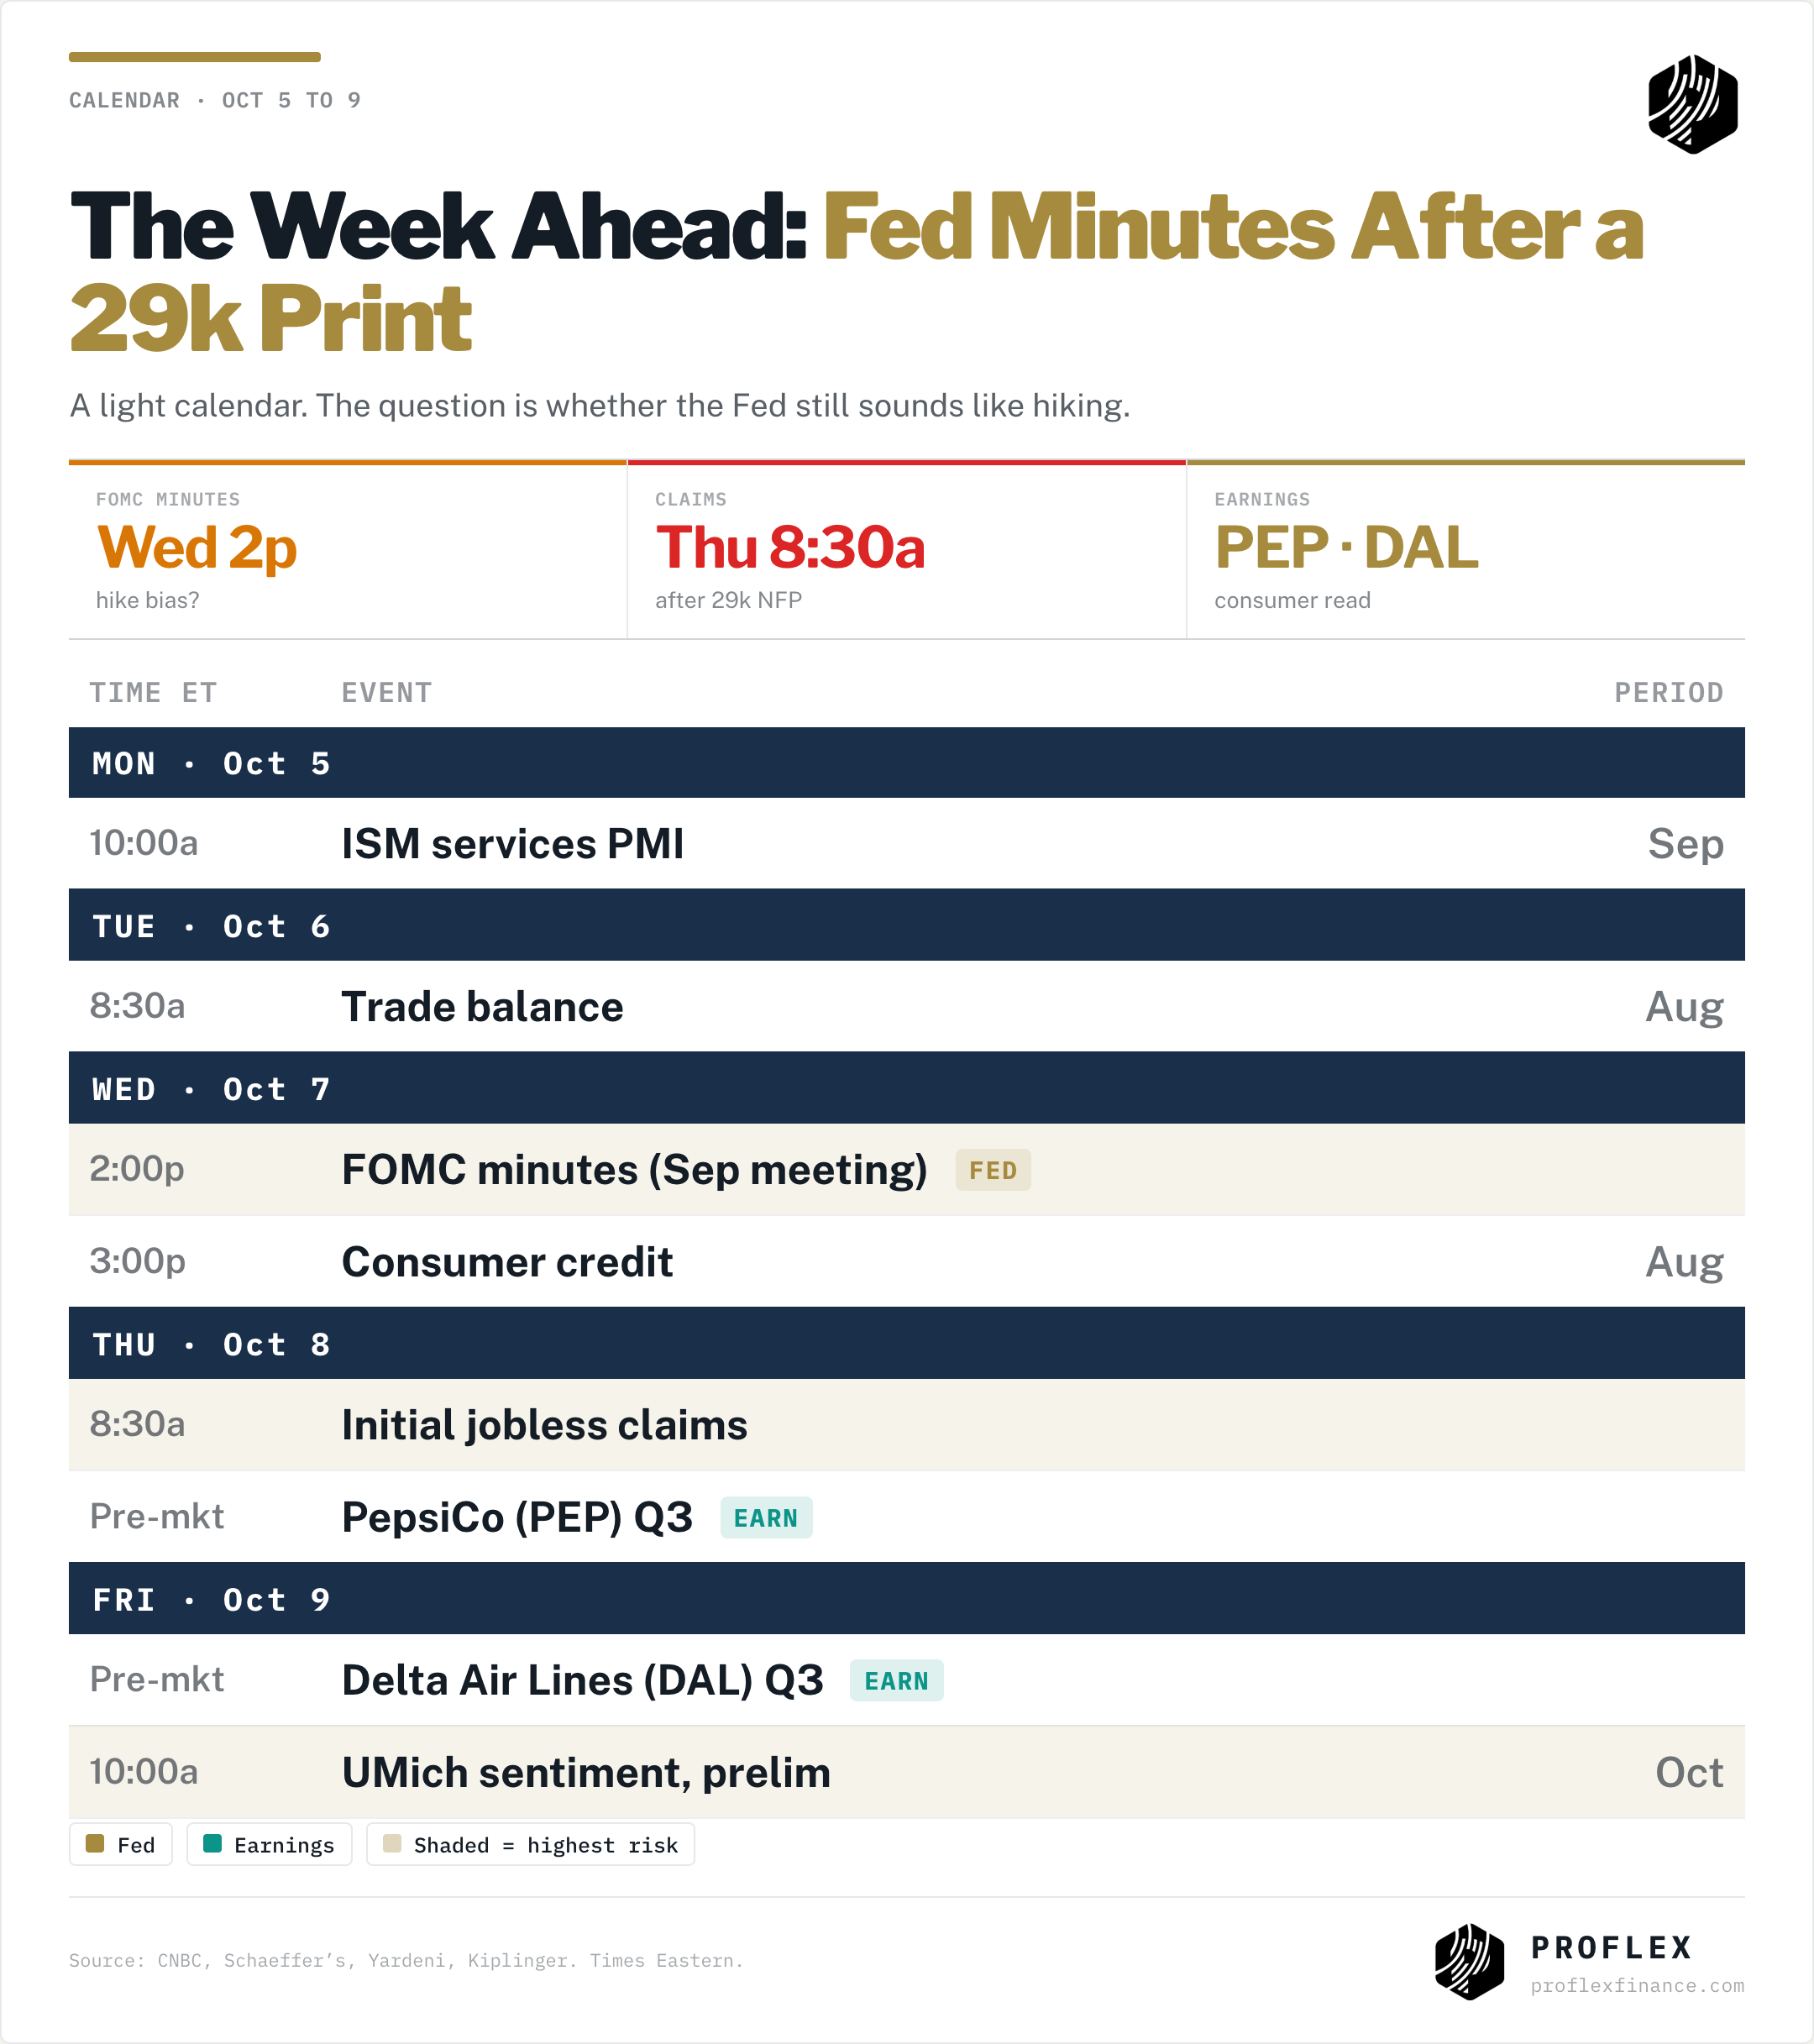
The labour market is the new swing factor. For months the debate was inflation and the Fed. A 29,000 jobs print shifts it. If hiring keeps slowing while rates stay high, consumer facing businesses feel it first. That is why PepsiCo and Delta matter this week more than they normally would. They are a direct read on whether the consumer is still spending at these rates.
Do not chase the laggards on price alone. Alphabet at 15% below its high and Broadcom at 26% below look tempting. But the market has marked them down for a reason: the spend is visible and the payoff is not yet. The signal to add is the revenue turning in their reported numbers, not the discount itself. Buy the evidence, not the gap.
Proflex View: Raman’s framing from the call is the one to hold onto: rates were high for most of modern market history and companies still grew. The test is not whether 5.3% is high. It is whether AI revenue grows faster than the cost of the money funding it. Today, for the leaders, it clearly does. For the borrowers, the jury is still out.
🔍 What We’re Watching
For three weeks we have named Brent at $120 as the trigger for a real correction. It has not been reached and remains our line
FOMC minutes on Wednesday: how many members wanted more hikes, and whether the jobs miss changes that
Jobless claims on Thursday, the first labour read after a 29,000 payroll print
The 10 year against 5.34%. A new high there would test equities harder than this week did
Whether the equal weight S&P holds its September low
PepsiCo and Delta for a read on the consumer, and Anthropic’s IPO filing timeline
🧭 Proflex Playbook – Follow the Revenue, Not the Index The index is being carried by a handful of AI winners while the median stock falls. That is not a reason to sell the winners. It is a reason to own the companies whose revenue is actually showing up, and to treat the laggards as next in line only when their numbers turn, not because they look cheap. Our conviction stays anchored in the data:
Focus on Structural Growth: Continue to overweight the secular AI theme, recognizing its multi-year runway.
Anticipate Shallow Corrections: Use dips as accumulation opportunities, not reasons for fear, understanding that "none of the corrections stick."
Diversify Thoughtfully: Recognize the "decorrelation" across asset classes; consider gold, silver and Bitcoin for portfolio resilience.
Develop Mental Models: Prioritize long-term planning (6-12 months out) over short-term news, aiming for consistent, incremental gains.
If you're an All-Access or Managed Portfolio subscriber, our positioning has already shifted ahead of this moment—scaling up asymmetric hard asset plays while hedging for earnings volatility and geopolitical tail risks.
Proflex All-Access: Your Market Compass
Explore the financial markets with Proflex All-Access, your comprehensive resource for deeper market understanding and active participation. This premium service offers subscribers exclusive insights and actionable investment advice, giving you a significant edge in various market conditions.
Proflex All-Access provides detailed analyses and recommendations to optimize your investment strategy. Our specialized newsletters include:
• Growth Gazette (Contains Crypto Pulse) : Aimed at achieving above-market returns for aggressive portfolio growth.
• Income Insider: Focused on conservative strategies and income generation for yield-seeking investors.
Until next week, — The Proflex Team Trusted Macro Insights. Calm Investing. Tactical Trades.
Elevate your financial IQ
ProFlex® by Proflex Finance Legal Disclosures
ProFlex® by Proflex Finance, the premium newsletter product series, provides informational and educational content only and does not offer personalized investment advice or establish a fiduciary relationship. While we rely on reliable sources and research, the information is not tailored to individual financial situations. Readers are urged to consult qualified financial professionals before making investment decisions. We do not guarantee the accuracy, completeness, or timeliness of the information and are not responsible for any investment decisions based on this newsletter. Investing carries risks, and past performance doesn't predict future results. By accessing this newsletter, you acknowledge that we are not liable for actions or decisions resulting from its content. Please conduct due diligence and seek professional advice as needed.
Frequently Asked Questions
Earnings reports reveal actual business performance versus market expectations. Revenue growth, profit margins, and forward guidance drive stock re-ratings. Beats or misses relative to consensus estimates move individual stocks and can shift sector-wide sentiment. Earnings season also provides insight into broader economic health and consumer spending trends.
The Fed targets 2% inflation measured by the PCE index. When CPI or PCE readings come in above target, the Fed may maintain or raise rates to cool the economy. Below-target readings give the Fed room to cut rates. Markets watch these releases closely because they signal the direction of monetary policy.
Massive capital expenditure on AI infrastructure (data centers, GPUs, networking) is creating a new investment super-cycle. Companies like NVIDIA benefit directly from hardware demand, while hyperscalers (Microsoft, Google, Amazon) invest billions in AI capabilities. This spending flows through to semiconductor suppliers, power utilities, and cooling technology companies, creating multi-layered investment opportunities.
Options expiration (especially quarterly "triple witching") can create significant short-term volatility as dealers unwind hedging positions. Gamma exposure determines whether dealer hedging amplifies or dampens moves. Negative gamma environments can accelerate selloffs, while positive gamma tends to suppress volatility. Large open interest strikes often act as price magnets into expiry.
Sector rotation signals include divergence between growth and value indices, relative strength shifts in sector ETFs, credit spread movements, and changes in the yield curve. When defensive sectors outperform cyclicals, it often signals risk-off positioning. Monitoring small-cap (Russell 2000) relative to large-cap performance provides insight into economic confidence and risk appetite.