Record $9.6 Trillion Expiry | CPI Friday | Oracle Thursday | The Momentum Wreck Underneath
"The S&P 500 has gone nowhere for five weeks while the momentum factor has had its worst quarter in twenty five years. Both of those are true at the same time, and the largest options expiry ever measured is what finally forces the tape to pick one of them." — Proflex Panel
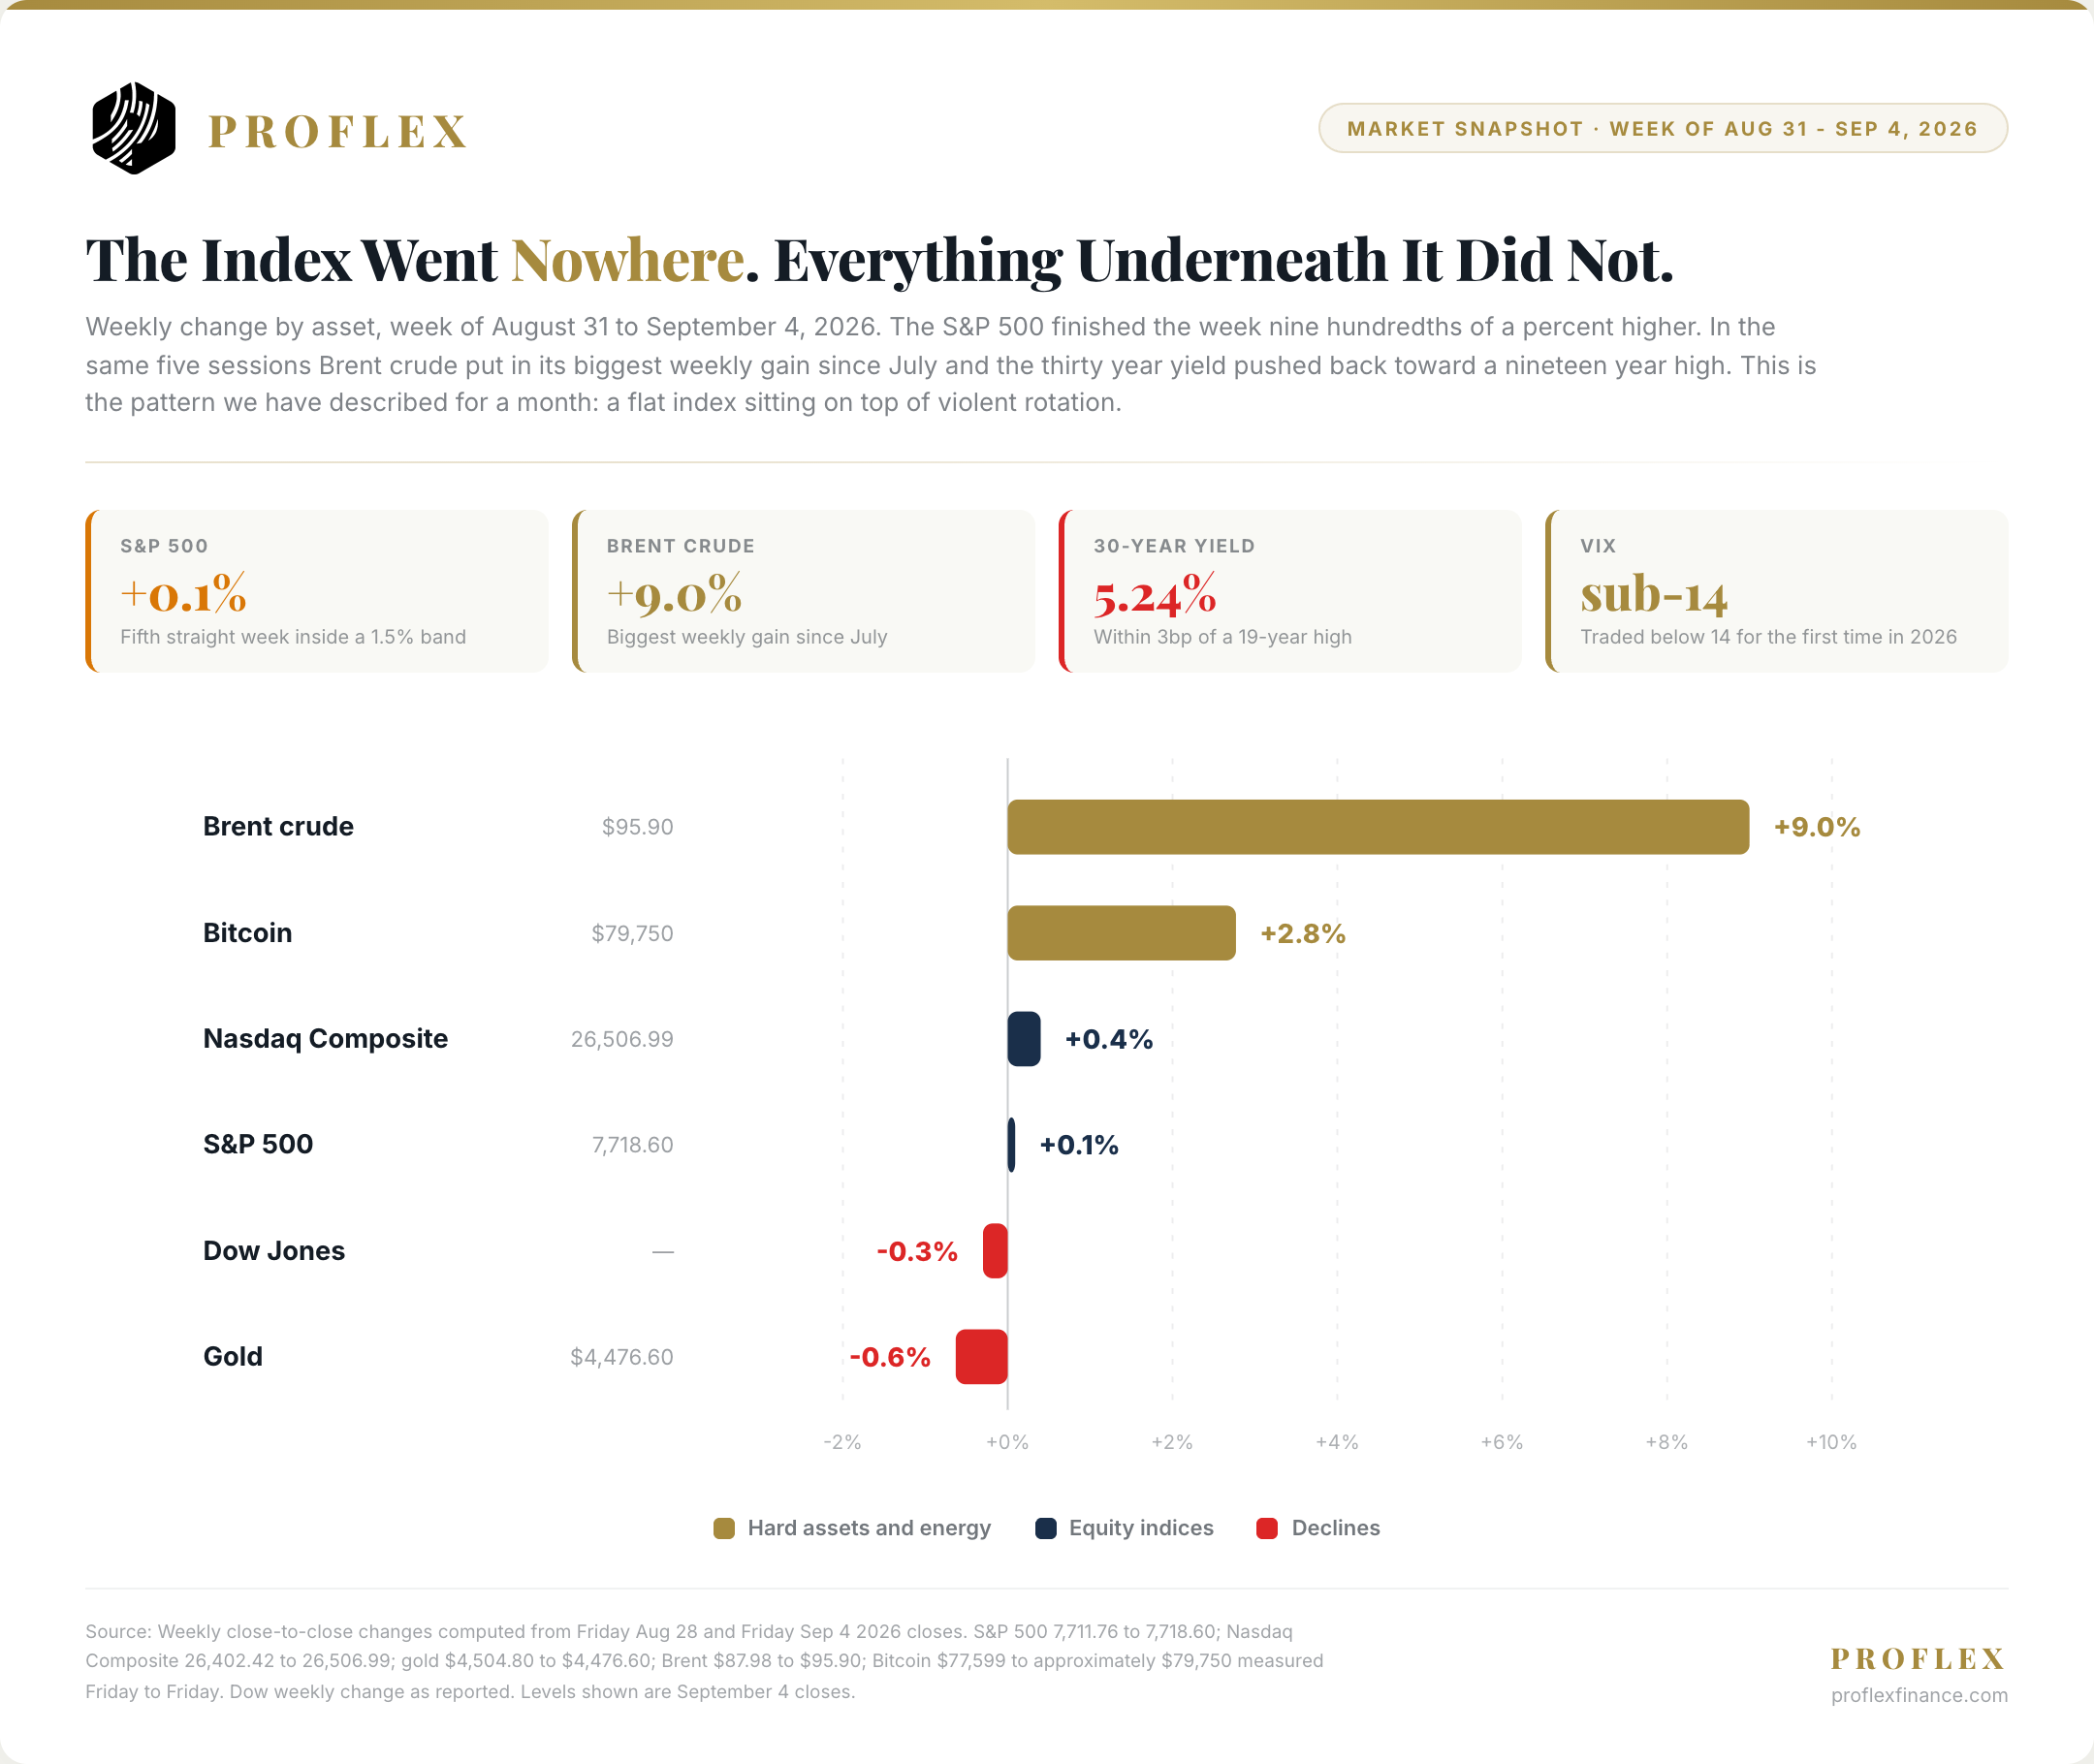
The S&P 500 closed Friday at 7,718.60, up nine hundredths of one percent on the week. That is the fifth straight week the index has finished inside a band of about one and a half percent. Nothing to see.
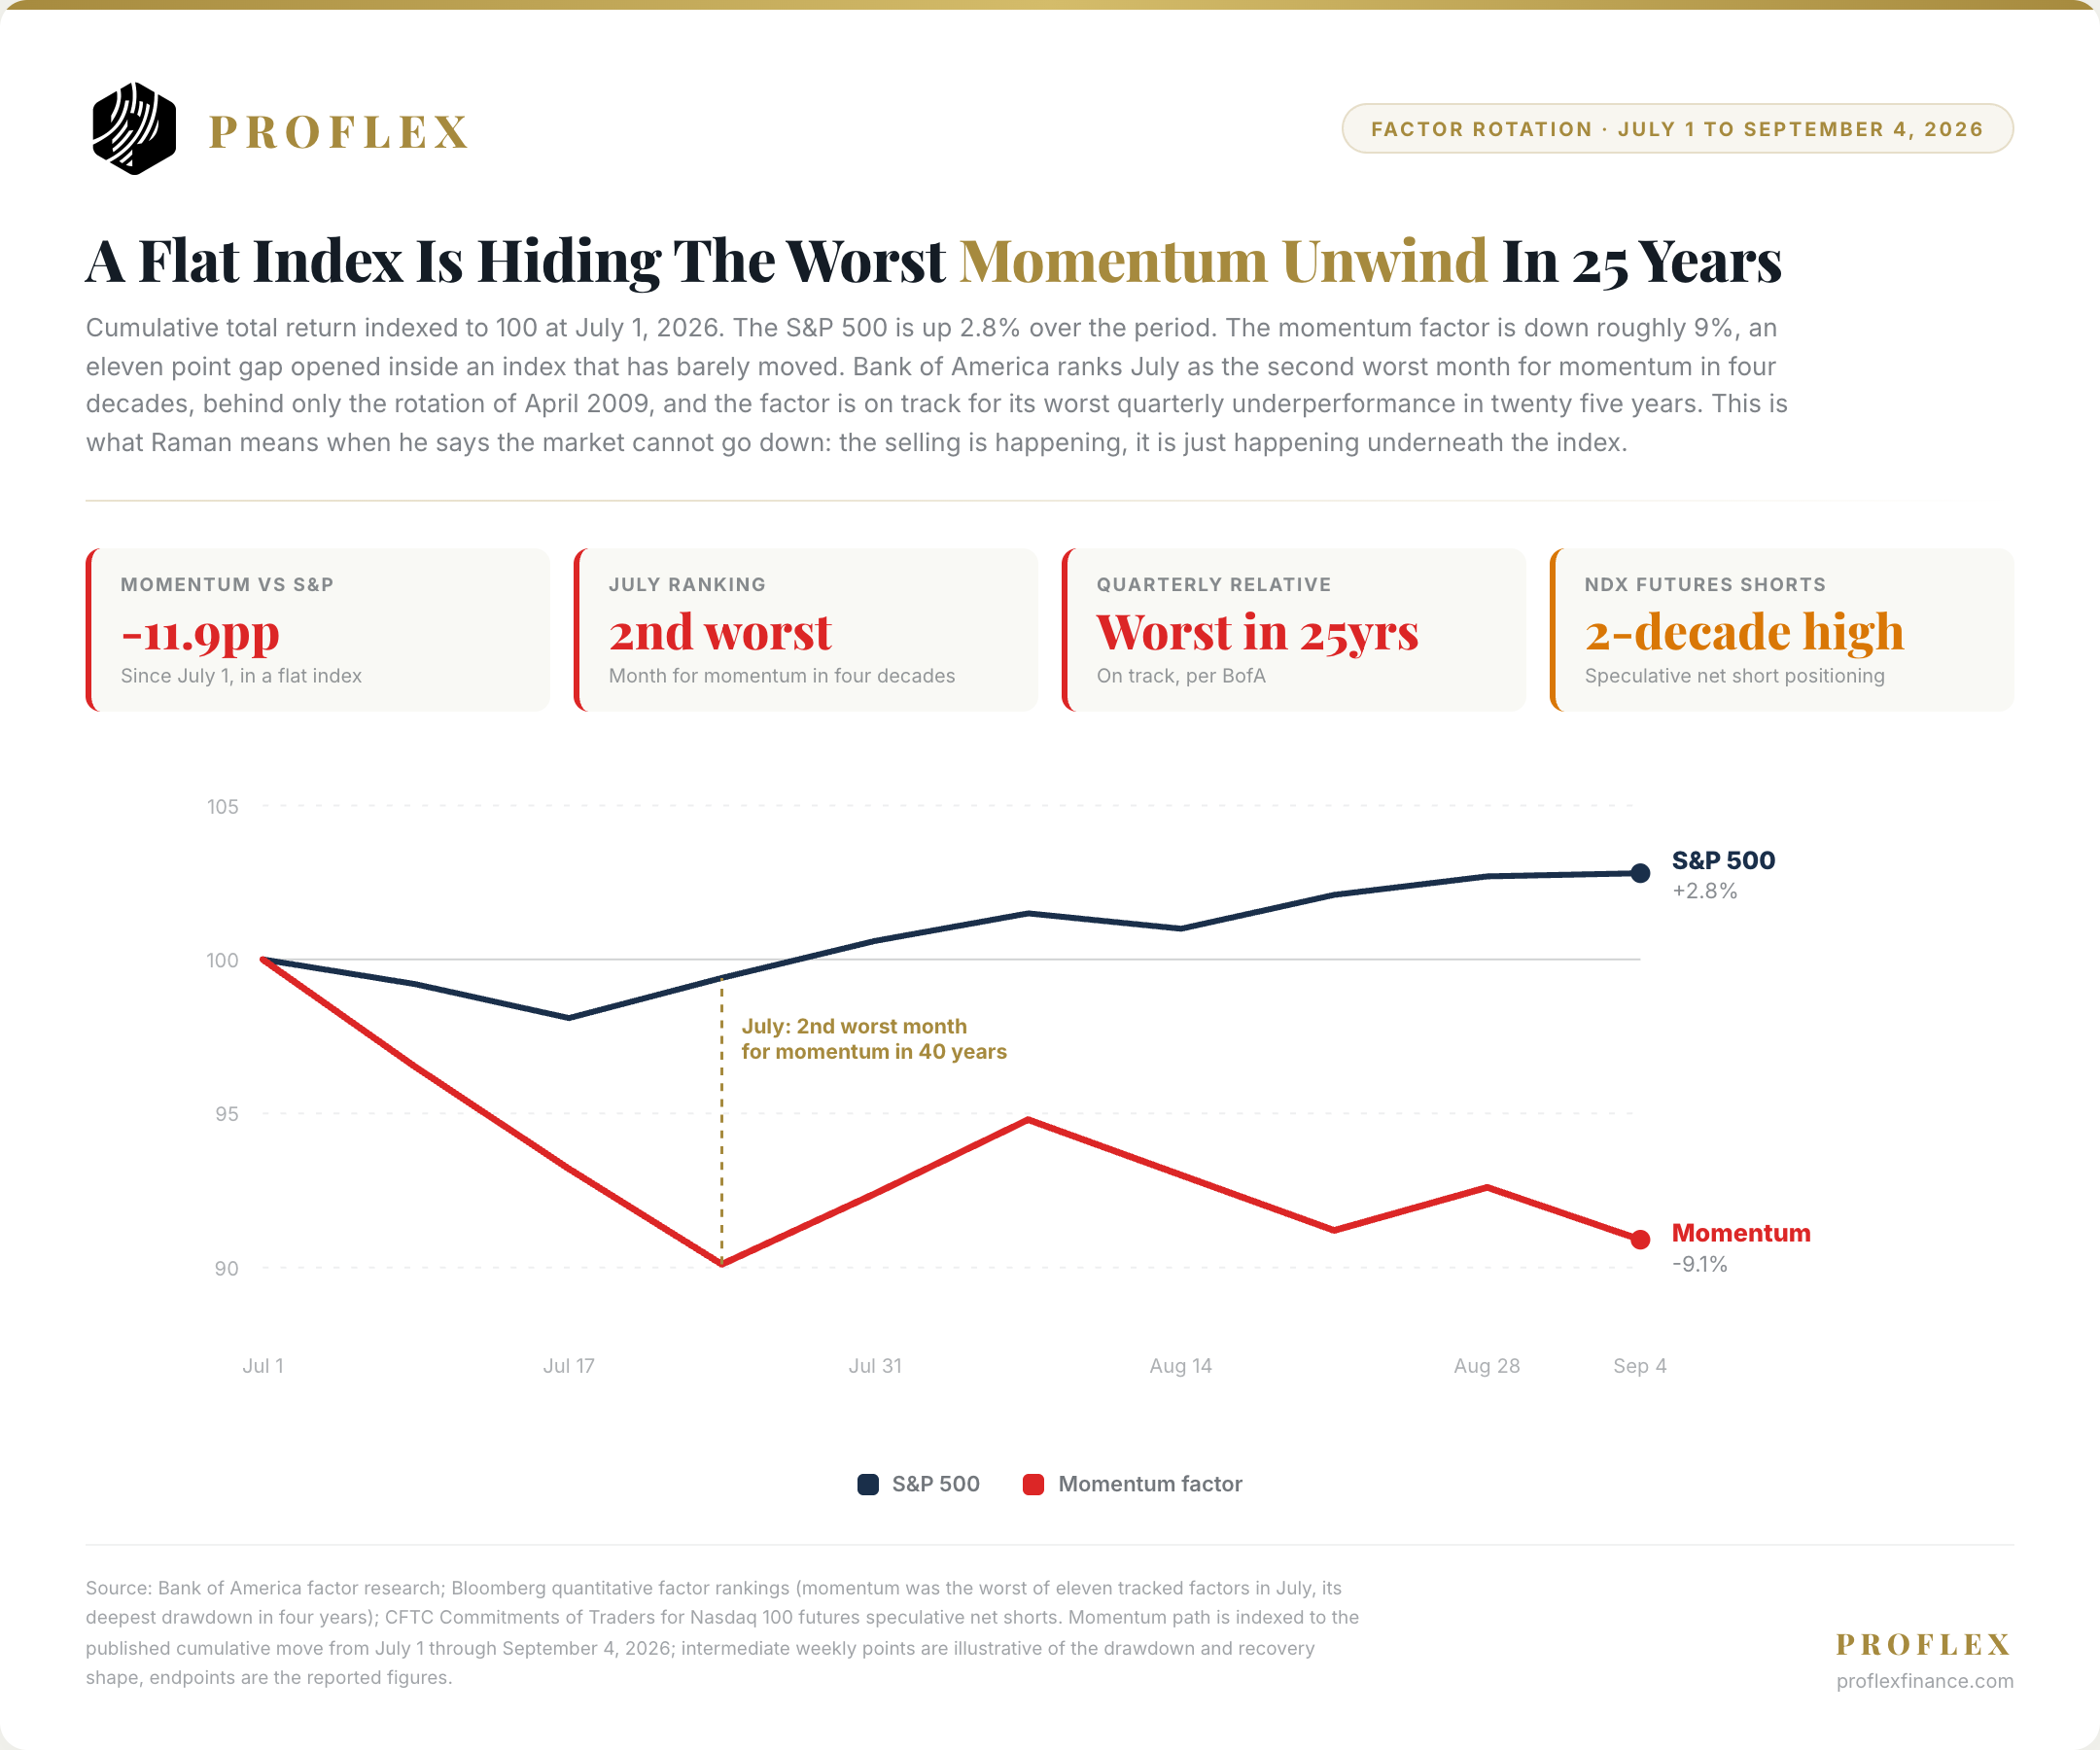
Now look underneath it. Brent crude put in its biggest weekly gain since July, up 9.0% to $95.90 on renewed US and Iran tensions. August payrolls came in at +162,000 against a consensus of 53,000, the strongest print since March and the first up month in five, with June and July revised up a combined 55,000. The ten year yield rose to 4.78% and the thirty year to 5.24%, back within three basis points of a nineteen year high. And the momentum factor, the single most crowded trade of this cycle, is now down roughly nine percent since July 1 while the index it lives inside is up 2.8%.
This is the pattern we have been describing since early August, and it has now gone on long enough to be the thesis rather than an observation. The index cannot fall because the rotation is doing the work that a correction would normally do. Money leaves semis and arrives in energy. It leaves momentum and arrives in nothing in particular. The aggregate never moves.
Two things end that. The first is Friday, when the August CPI lands as the last data point before the September 16 FOMC with every Fed official already in blackout. The second is September 18, when $9.6 trillion of notional options exposure rolls off in the largest expiry event ever measured. The question for the next two weeks is not direction. It is whether this market still has a mechanism for expressing one.
What We Said on the Macro Call
We have never read this market as one thing. It is not a bull market or a bear market right now, it is pockets, and the whole exercise this year has been keeping track of which pocket is paying you. Friday was mostly about the one that is not.
On momentum. We walked through the basket and made the case that the wreck underneath the index is more advanced than the ETF version of it looks. Two rounds of forced deleveraging have already come out of this trade. What is left is compressing into a triangle that gets narrower every week, and we do not think it stays in there much longer. Semis are the tell.
On rates. This is the point we spent the most time on, because we think it is the one most people have wrong. AI capex ignored the ten year for eighteen months. It cannot ignore it now, and the reason is a change in how it is being funded rather than anything about the technology. We think that is the actual overhang, not the AI story.
We also went through the expiry and why we think volatility can rise without any bad news at all, where we are on Bitcoin and gold after the January top we called, and why the Tesla robotaxi headline is a milestone rather than an earnings event. Those are worth the recording.
Proflex View: That triangle is the right frame, and the data now supports it harder than it did on Friday. Bank of America ranks July as the second worst month for momentum in four decades, behind only April 2009, and the factor is on track for its worst quarterly underperformance in twenty five years. Speculative net shorts in Nasdaq 100 futures sit at a two decade high. A crowded trade that has already been liquidated is not the same risk it was in June. The asymmetry has flipped: the pain trade from here is up.
Key Drivers This Week
The Largest Options Expiry Ever Measured, With The Least Fuel Behind It
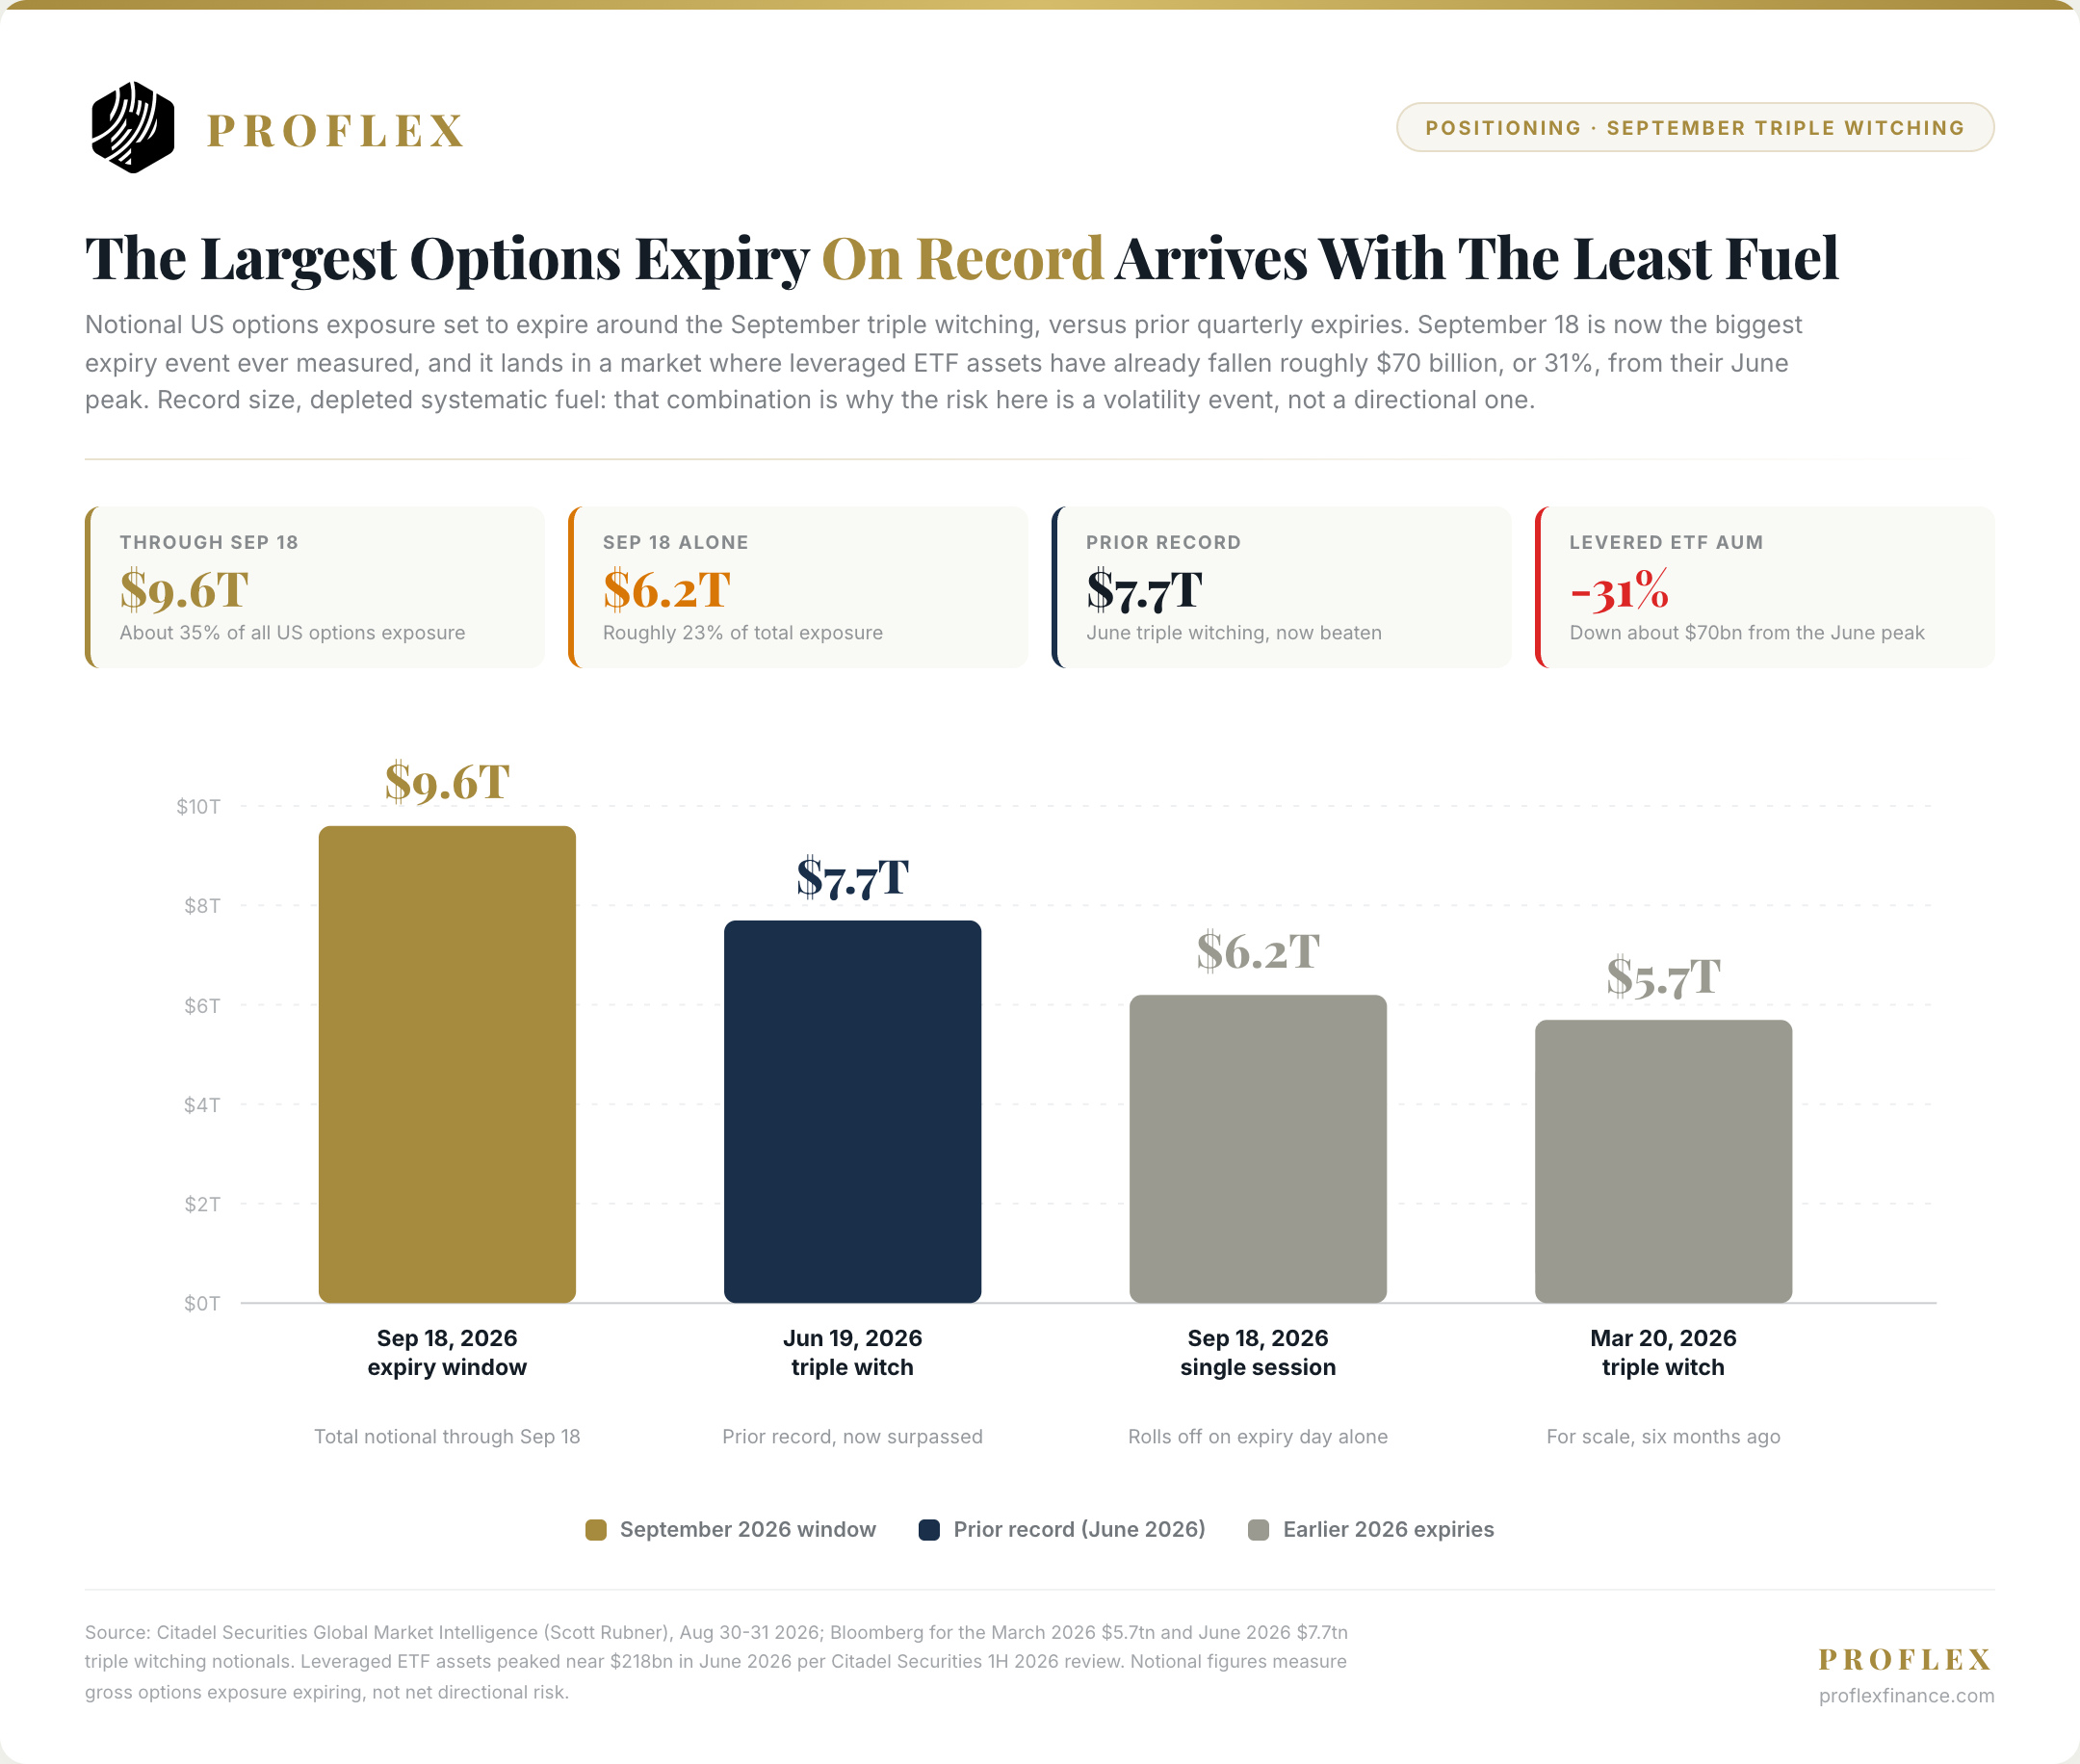
Citadel Securities puts $9.6 trillion of US options notional expiring between now and September 18, roughly 35% of all US options exposure, with $6.2 trillion rolling off on expiry day alone. The prior record was June’s $7.7 trillion triple witching. September has already beaten it.
The number that makes this interesting is the one next to it. Leveraged ETF assets, which peaked near $218 billion in June, have fallen about $70 billion, or 31%. The largest expiry in history is arriving into a market with roughly a third less systematic fuel than it had at the peak, a VIX that traded below 14 on Friday for the first time in 2026, and a volatility index that has now spent 25 consecutive sessions between 14 and 17, one day short of the record set in May 1992.
Read those together. Enormous gross exposure rolling off, thin systematic positioning, no hedges on, and a volatility surface priced for nothing to happen.
Proflex View: This is a volatility risk, not a direction risk, and the distinction matters. Record notional does not tell you which way the market goes; it tells you that whichever way it goes, the move will be larger than the news deserves, because dealers are repositioning and almost nobody is hedged. We would rather own optionality than conviction into September 18. The two week window after the roll, when fresh positions get built, is historically where the real trend for the quarter is set.
Friday’s Payrolls Broke The Tie. Friday’s CPI Breaks The Decision.
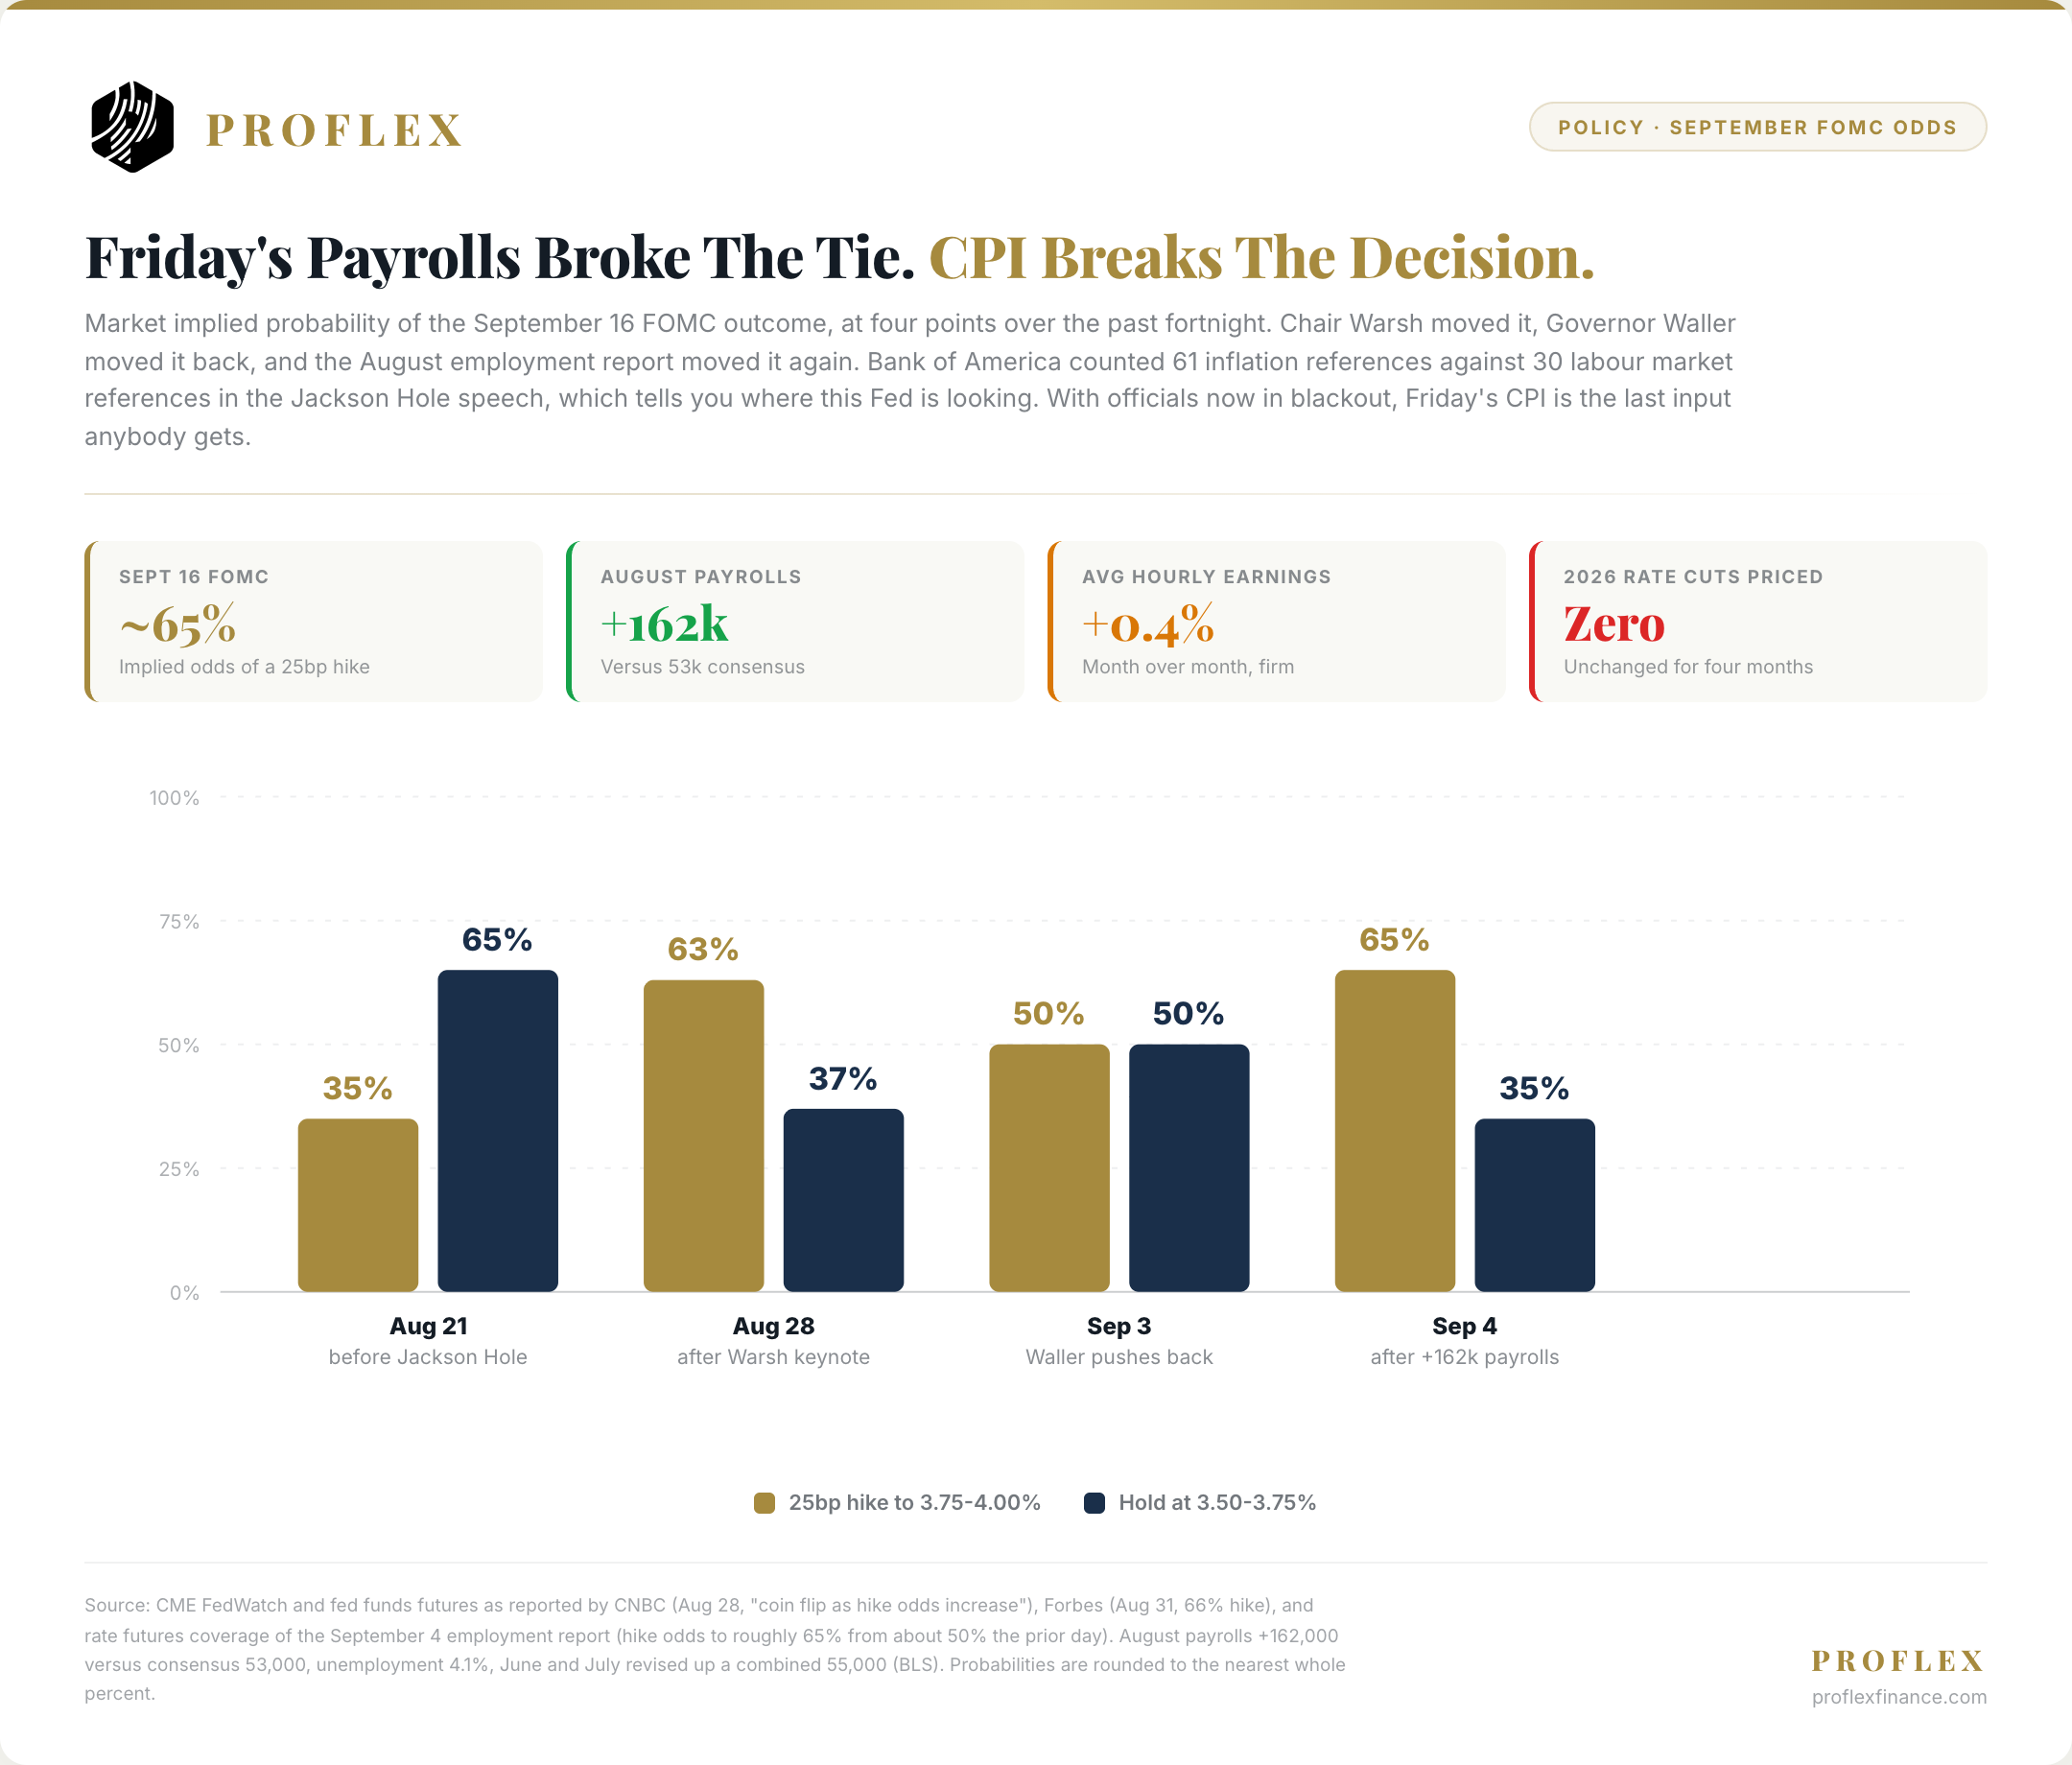
The September 16 meeting was a genuine coin flip on Thursday. Chair Warsh pushed hike odds past 63% at Jackson Hole, Governor Waller talked them back toward a hold, and then the August employment report landed: +162,000 against 53,000 expected, unemployment steady at 4.1%, average hourly earnings +0.4% month over month. Rate futures moved to roughly 65% odds of a 25 basis point hike, from about 50% the day before. Cuts priced for 2026 remain at zero, where they have been for four months.
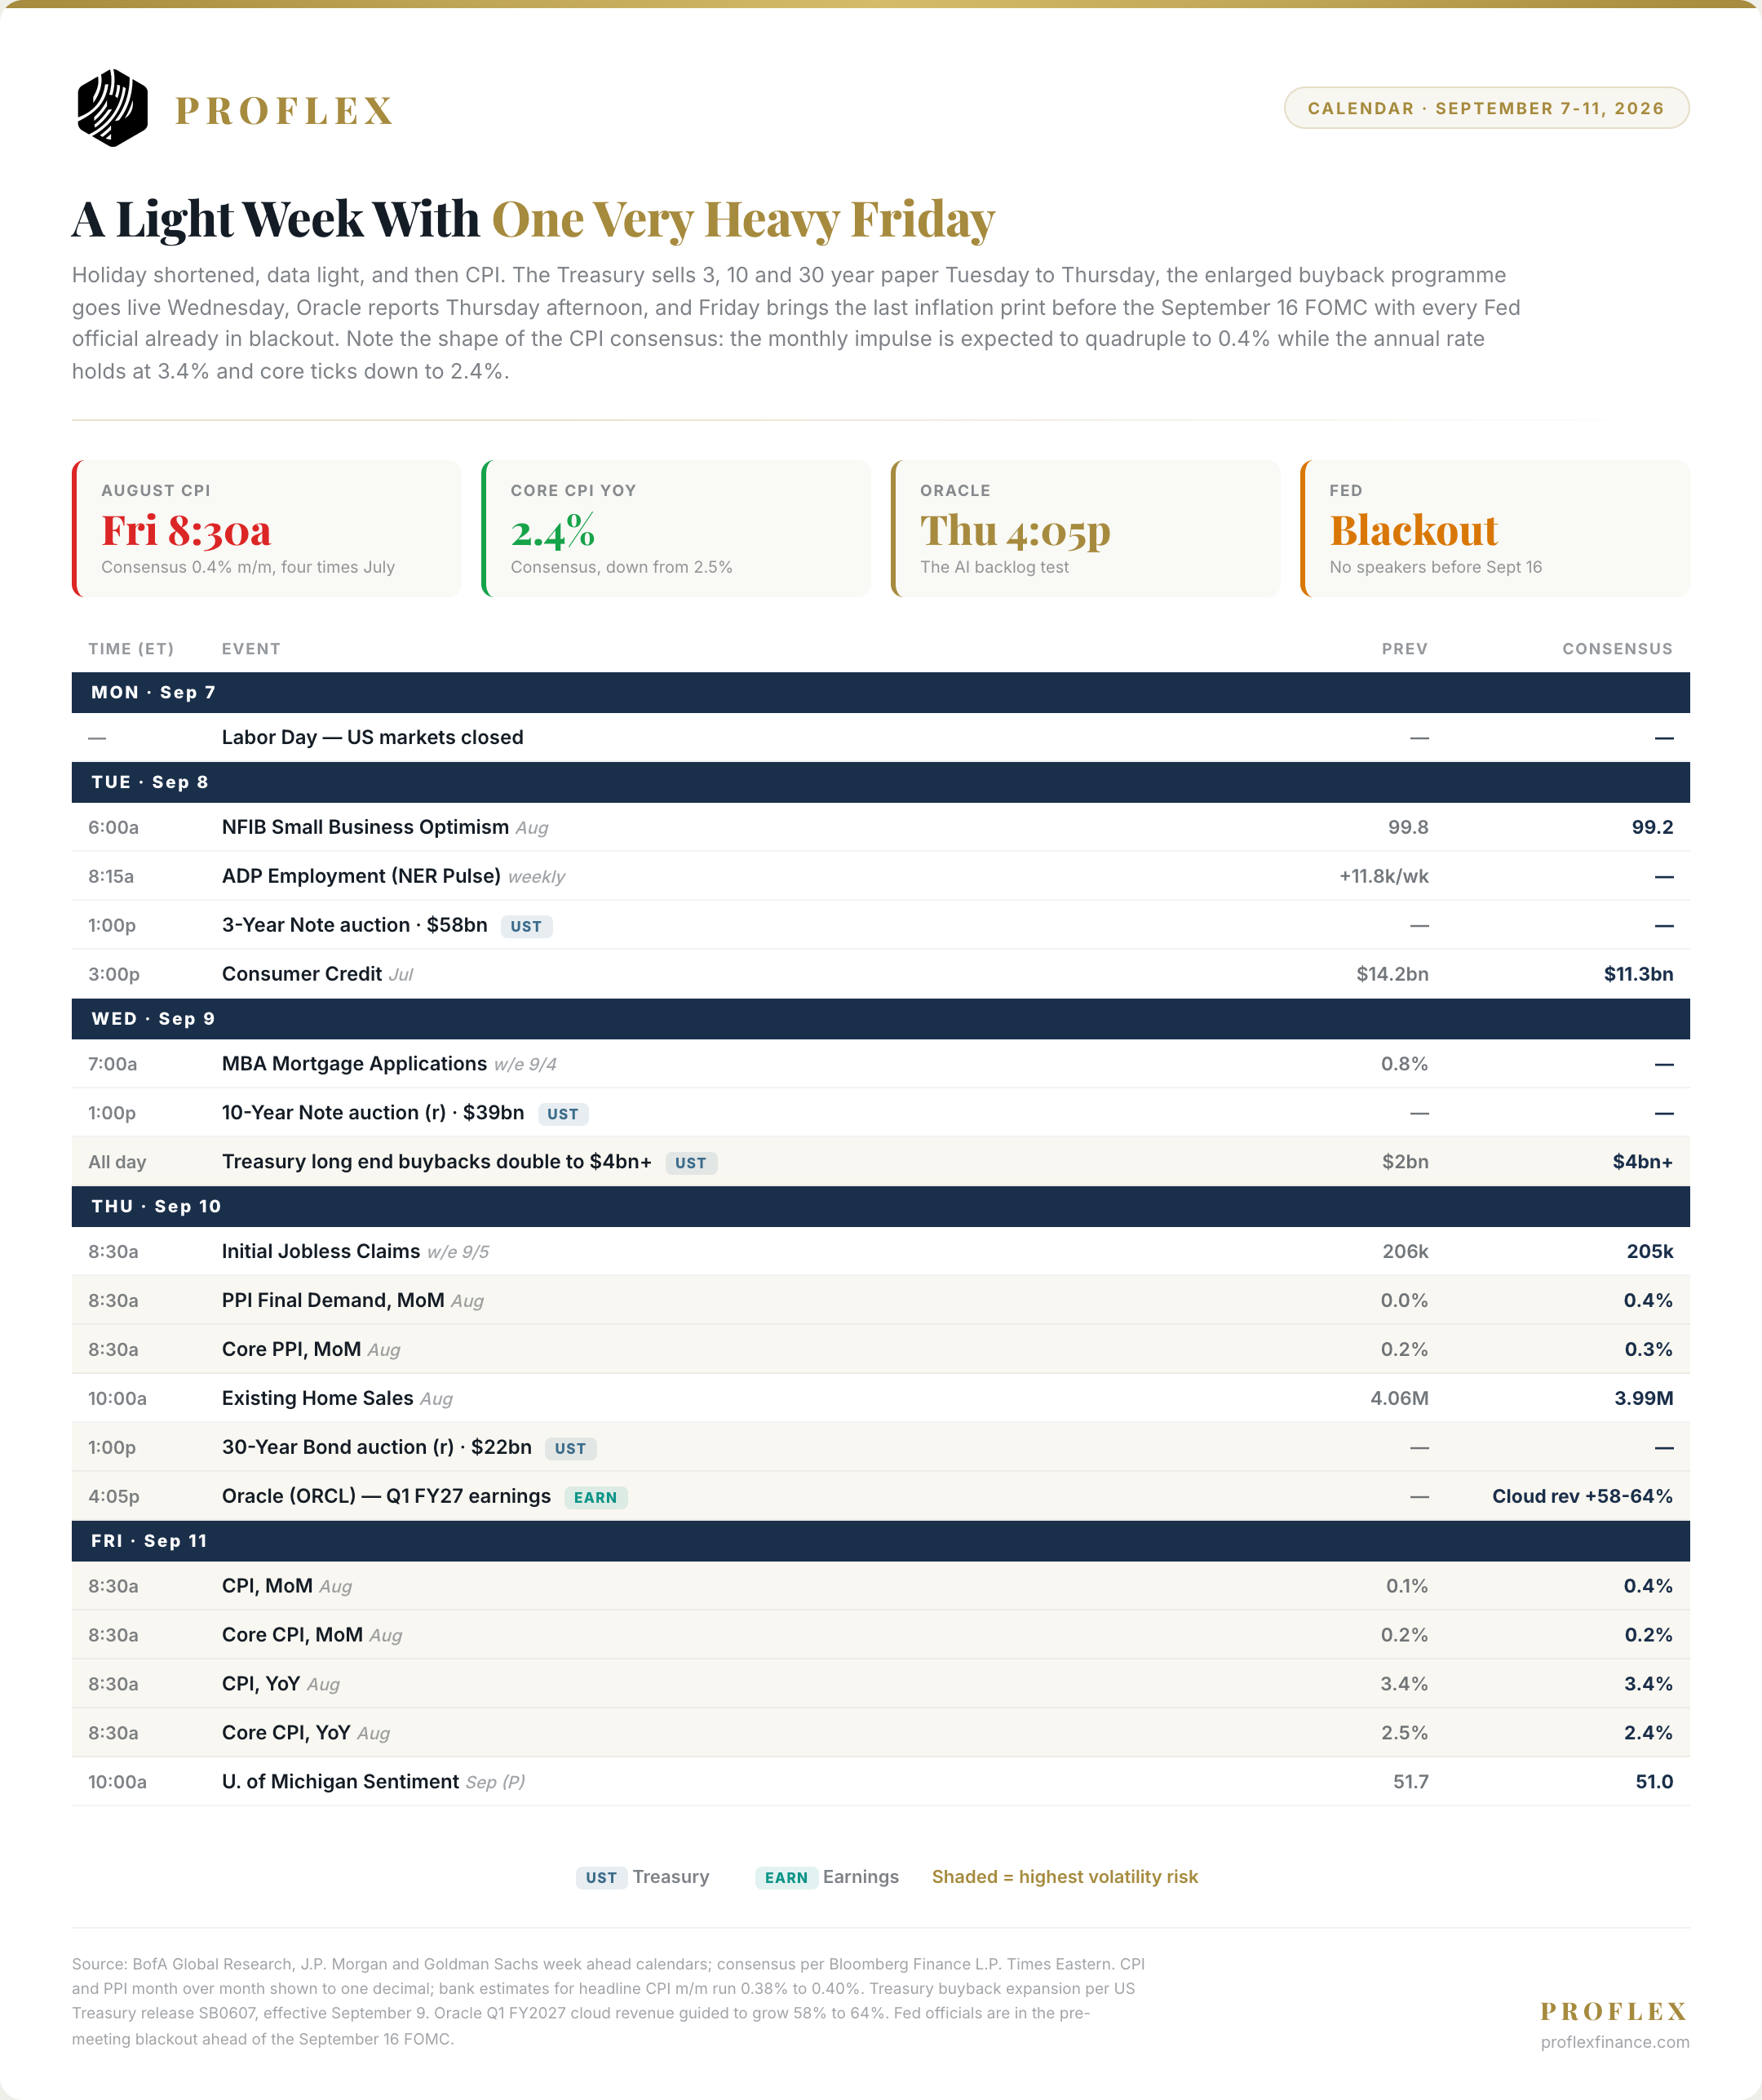
Bank of America counted 61 inflation references in the Jackson Hole speech against 30 references to the labour market. This Fed is not looking at jobs. Which is why Friday is the whole ballgame, and why the shape of the consensus matters more than the headline: economists expect August CPI at 0.4% month over month, four times July’s 0.1%, while the annual rate holds at 3.4% and core actually ticks down to 2.4%. Bank estimates cluster tightly, 0.38% to 0.40%.
Free Weekly Insights
Get This Analysis Every Week
Join 250+ investors at Google, Amazon & Apple who start their week with Proflex.
No spam. Unsubscribe anytime.
That is not a story about underlying inflation reaccelerating. That is oil. Brent is up more than 30% since late February and up 9% last week alone.
Proflex View: A hot headline driven by energy is the worst possible print for this market, because it arrives while the Fed is in blackout and cannot contextualise it. Our read is that a 0.4% headline with core at 0.2% locks the hike and the market takes it in stride, because 25 basis points was never the issue. The issue is whether Warsh signals that one hike is not enough. As we put it on the call, even 25 basis points is not a big deal; the question is the recommitment to 2% and what that implies for the long end.
Broadcom Cleared It. Oracle Is Thursday’s Test.
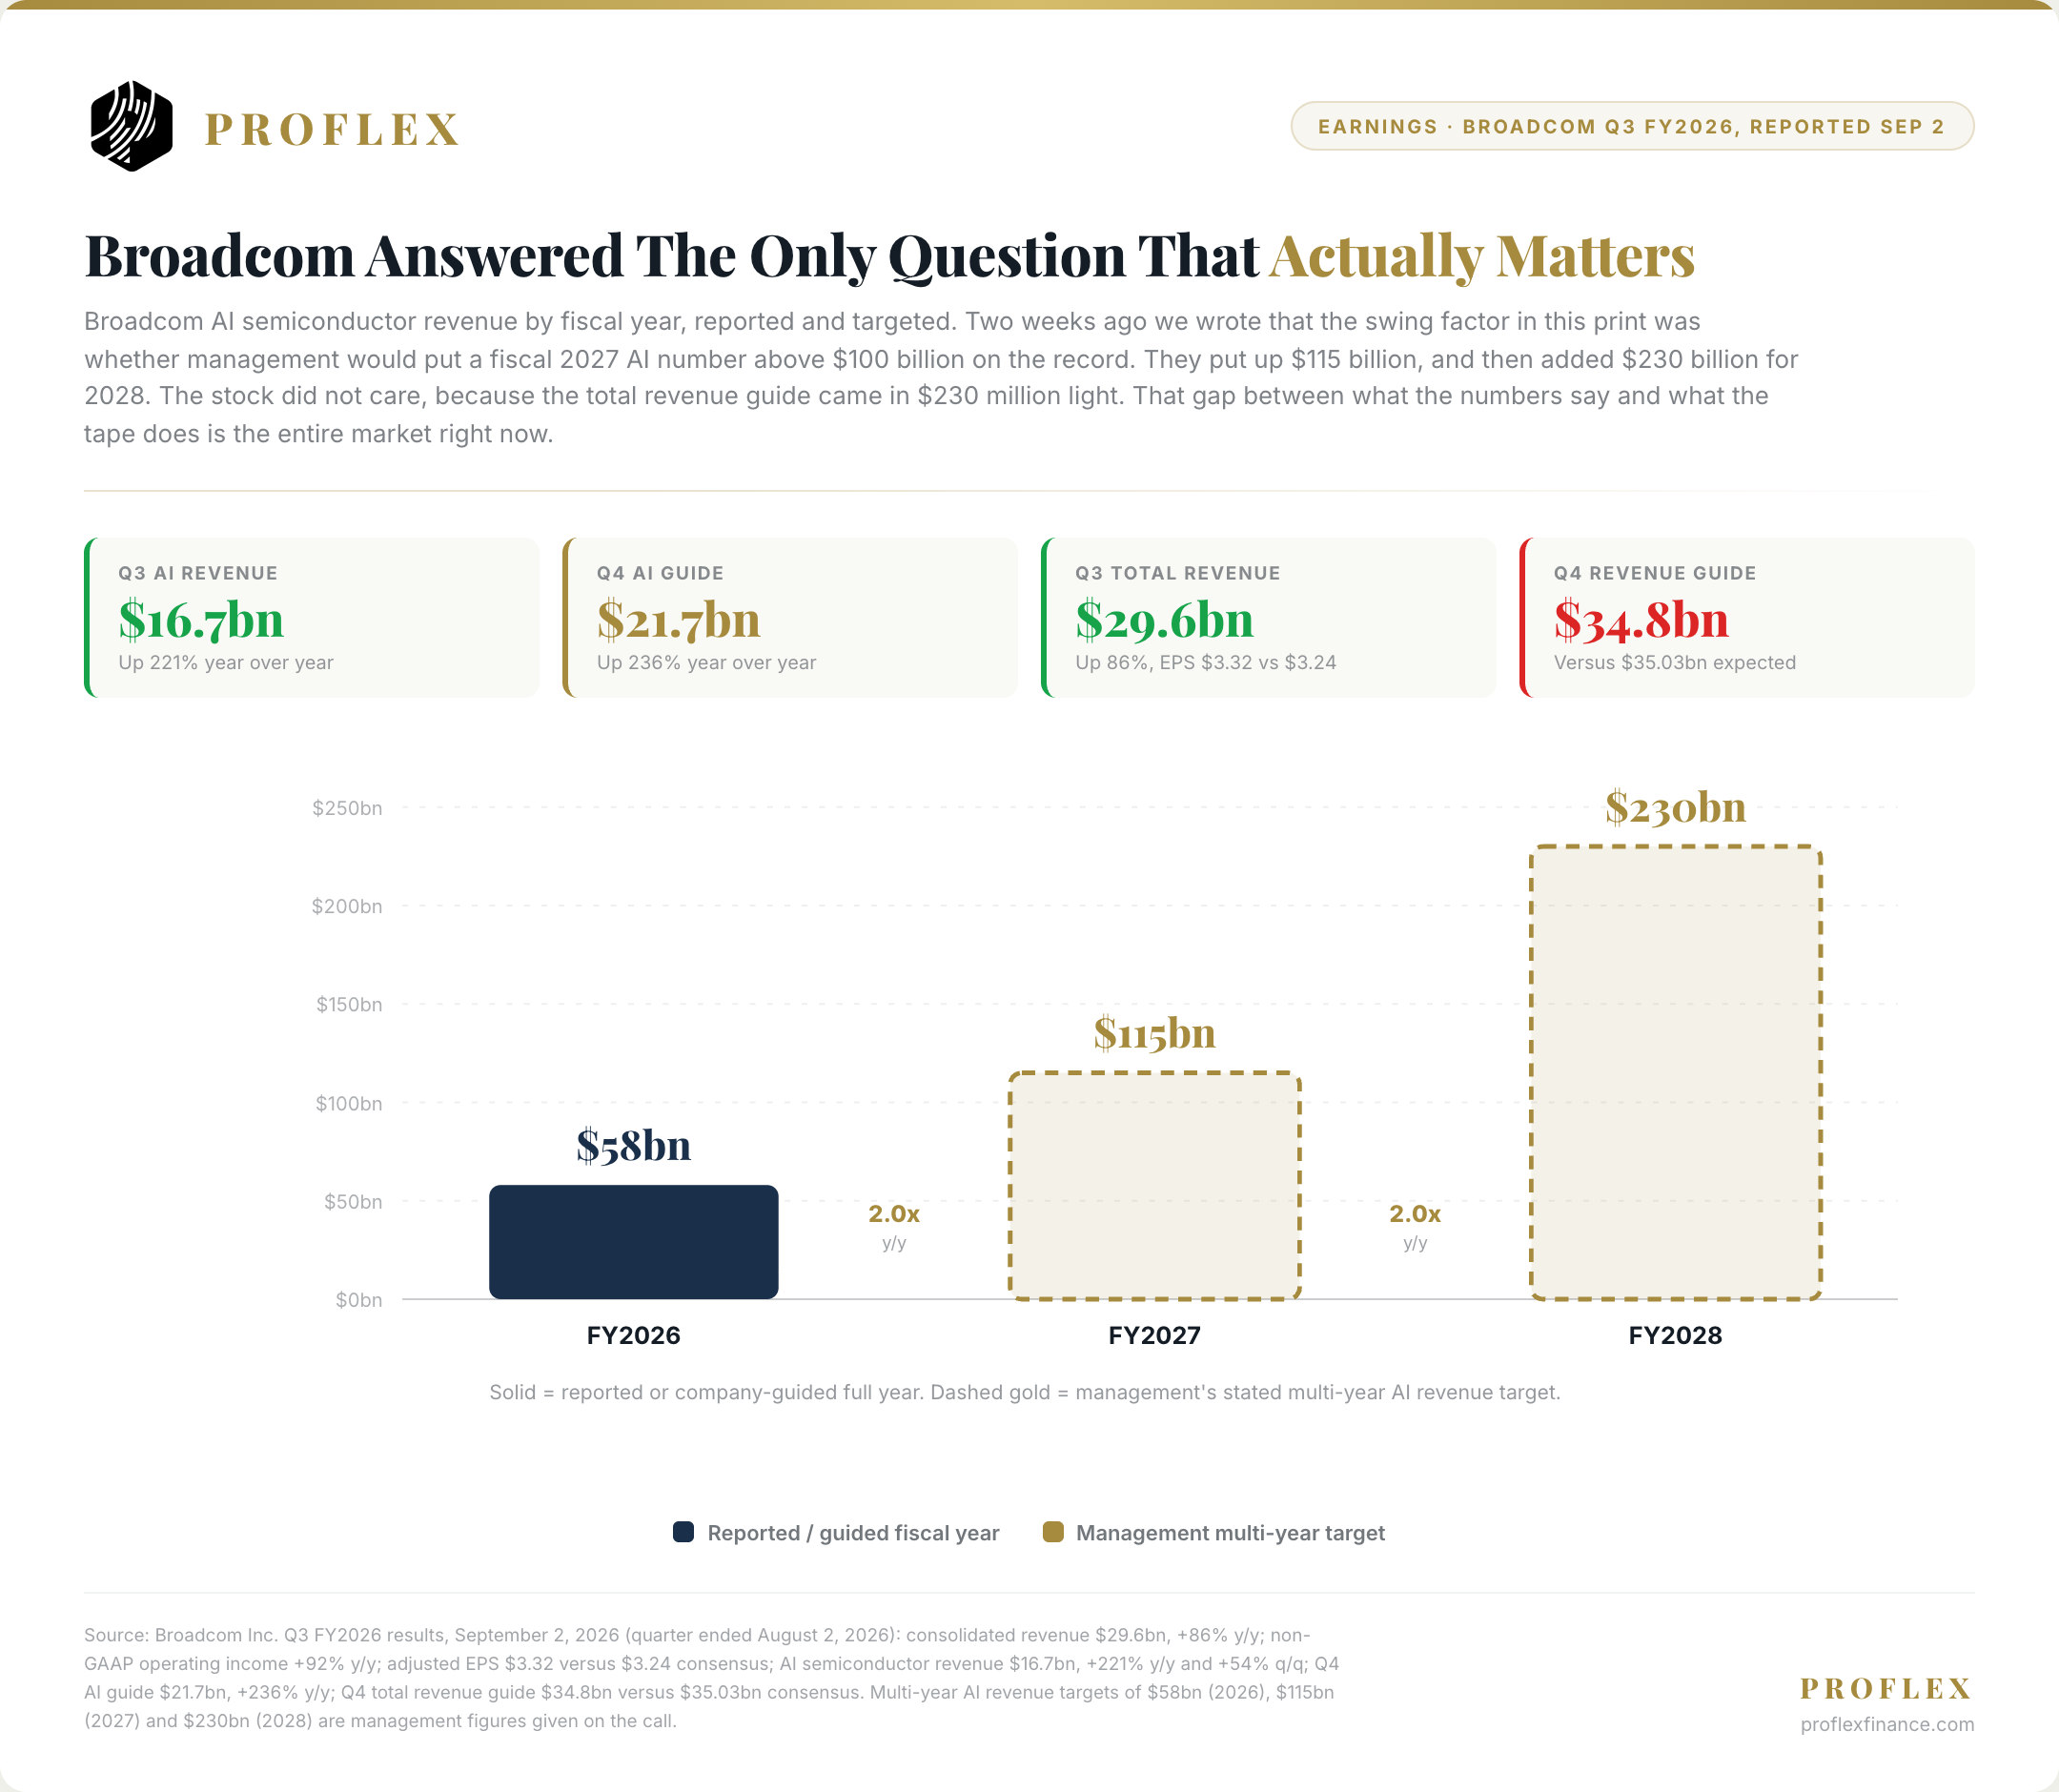
Two weeks ago in this letter we wrote that the swing factor in the Broadcom print was whether management would put a fiscal 2027 AI revenue number above $100 billion on the record. They did, and then some. Q3 revenue $29.6 billion, up 86%. Adjusted EPS $3.32 against $3.24 expected. AI semiconductor revenue $16.7 billion, up 221% year over year and 54% sequentially, with expanding business at both Anthropic and OpenAI. Q4 AI guided to $21.7 billion. And the multi year ladder: $58 billion in 2026, $115 billion in 2027, $230 billion in 2028.
The stock did not reward it, because the total revenue guide came in at $34.8 billion against $35.03 billion expected. A 0.7% miss on a $35 billion quarter, set against an AI business that is tripling, and the tape chose the miss. That is the cleanest illustration we can offer of where sentiment actually sits.
Oracle reports Thursday after the close and it is the more interesting of the two. Cloud revenue is guided to grow 58% to 64%, total Q1 revenue 27% to 29%, and Safra Catz has said she expects remaining performance obligations to push past half a trillion dollars. The stock is down nearly 20% in 2026. Broadcom proved the AI order book is real at the chip layer. Oracle is the test of whether the backlog converts on schedule at the capacity layer, which is the part of the chain that is debt funded.
Proflex View: We got this call right and it is worth being precise about why it still did not work. The number we said was the swing factor came in above our bar, and the stock fell anyway on a 0.7% revenue guide miss. The lesson is not that the thesis was wrong; it is that in a market with no marginal buyer for the AI theme, good numbers no longer clear the bar on their own. Oracle Thursday is the better read, because RPO conversion tells you something Broadcom’s backlog does not: whether the customers can actually pay for it.
The Long End Is The Real Constraint, And Wednesday Is The Date
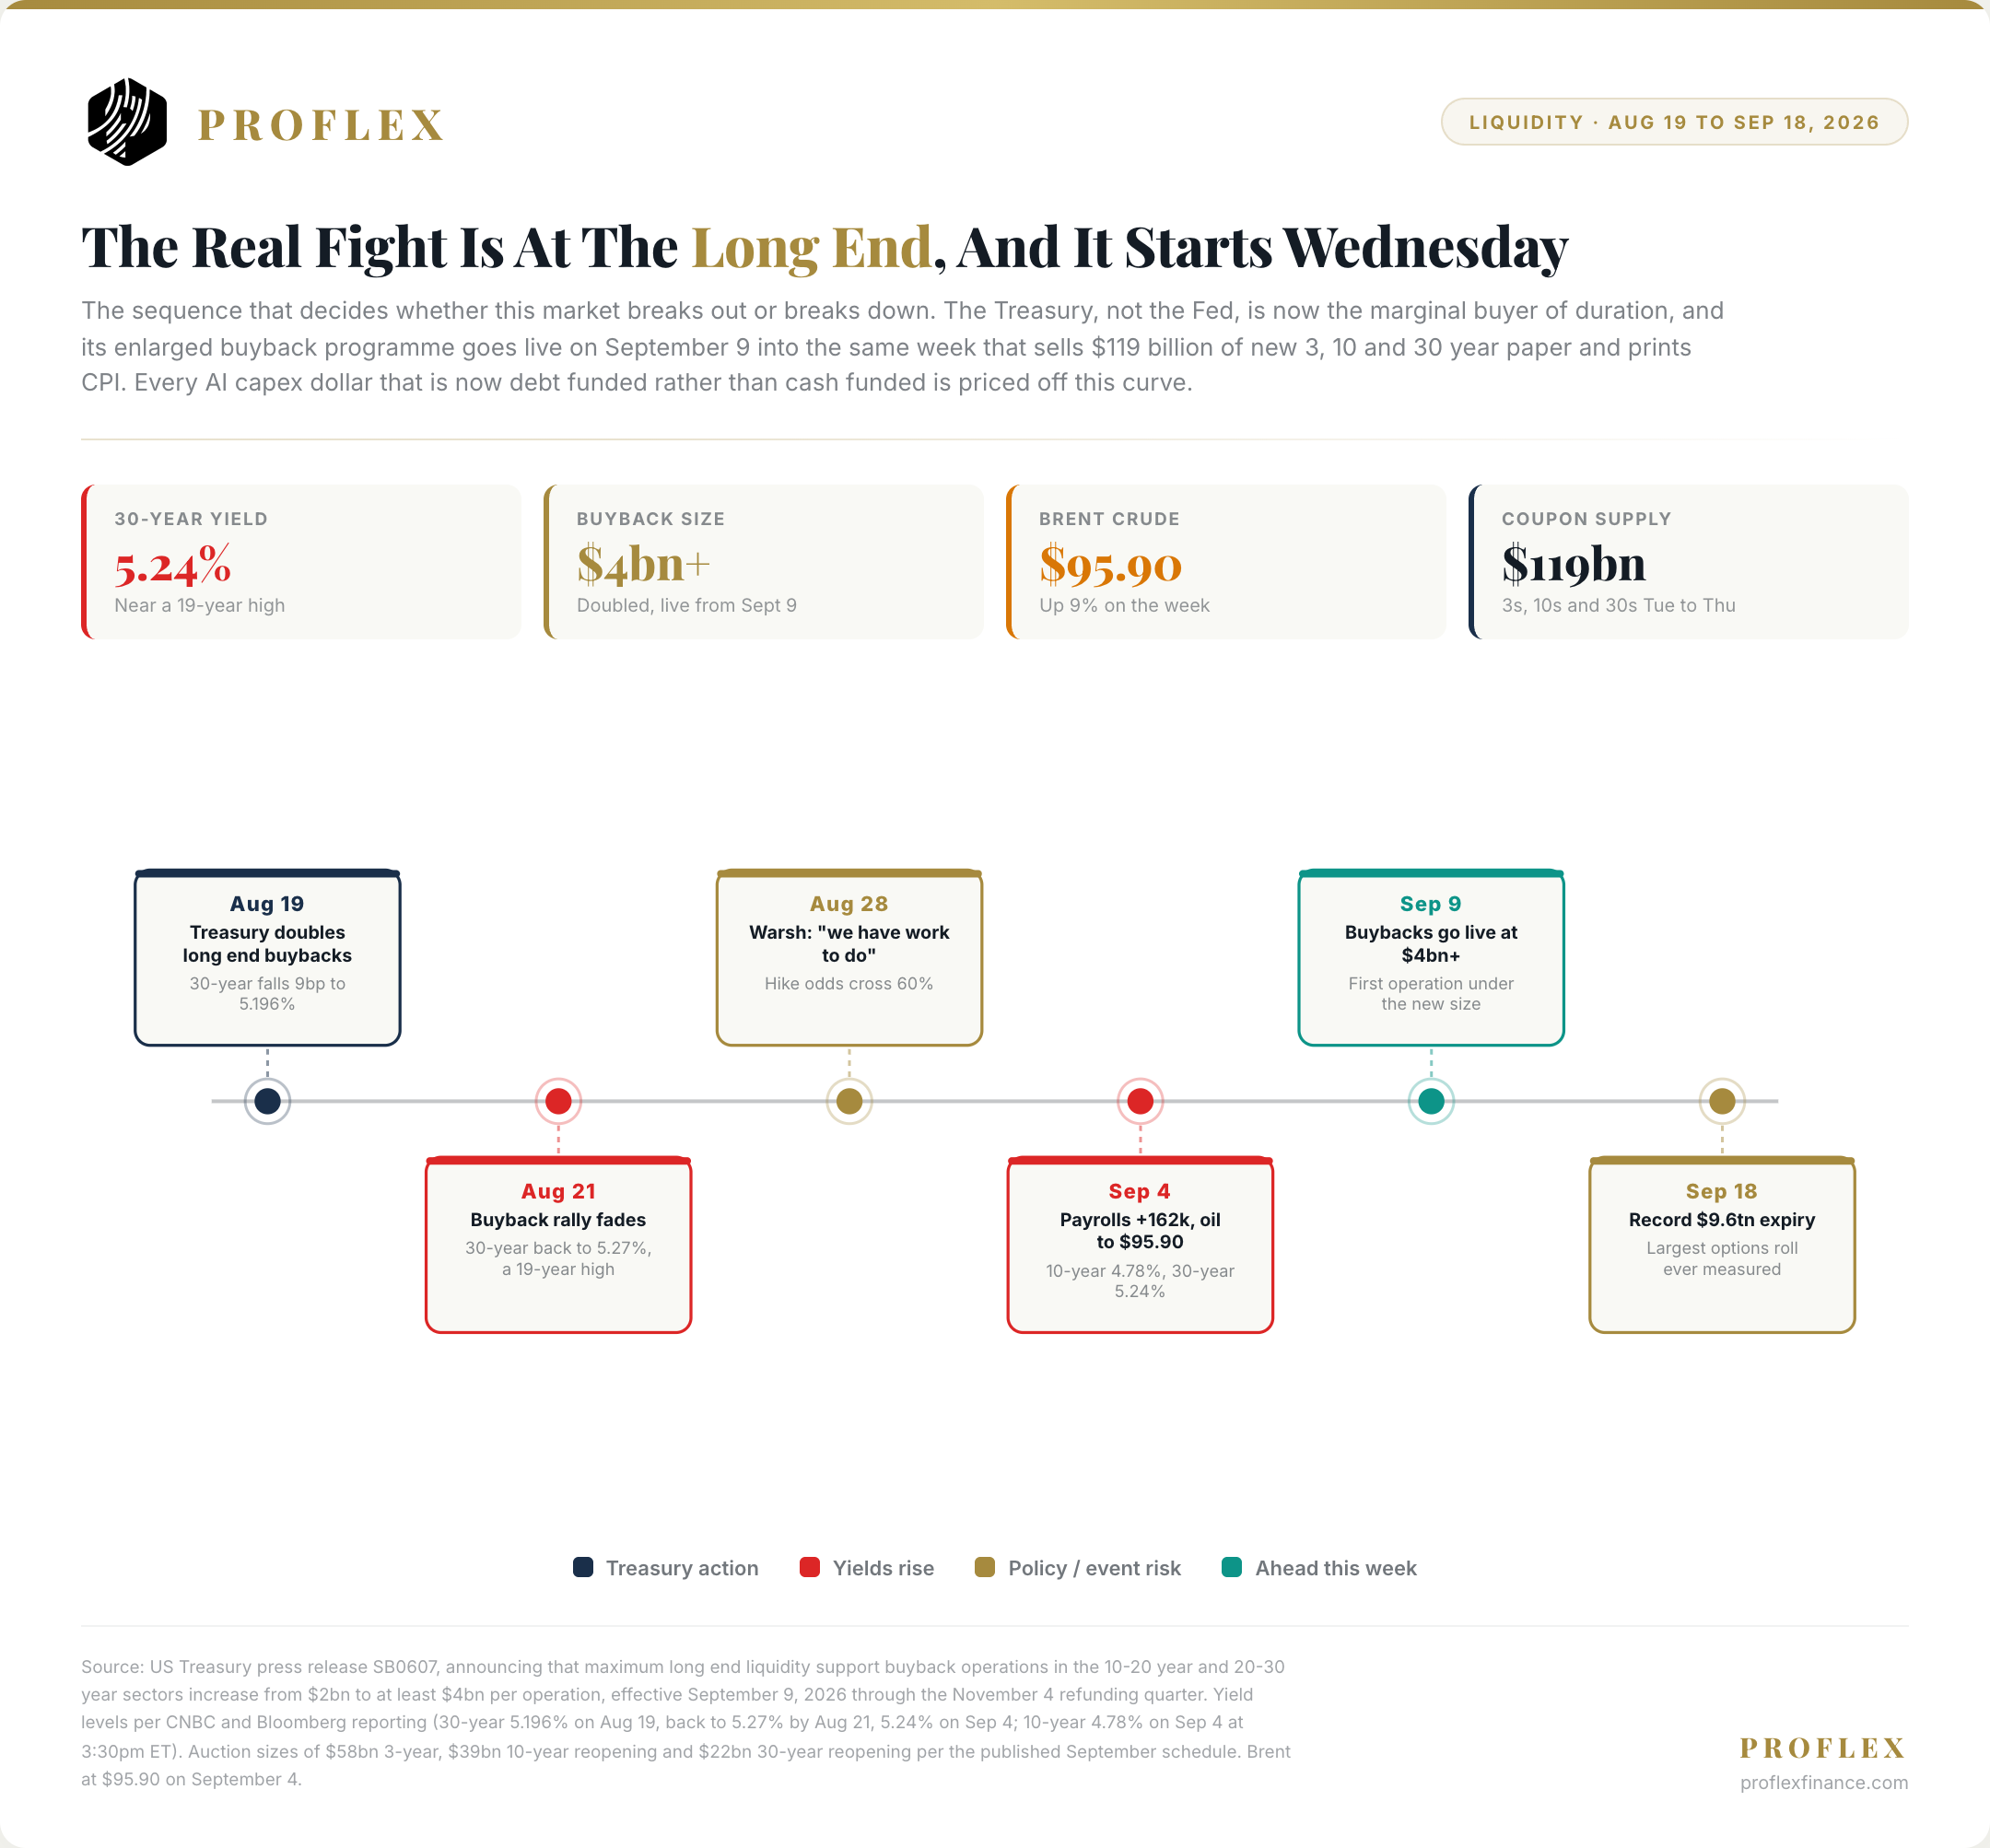
On August 19 the Treasury doubled the size of its long end liquidity support buybacks, from $2 billion to at least $4 billion per operation in the 10 to 20 and 20 to 30 year sectors. The thirty year fell nine basis points to 5.196% on the announcement. By August 21 the entire move was given back and the yield was at 5.27%, a nineteen year high. It closed Friday at 5.24%.
Tap into real-time commentary from Proflex experts on market shifts, policy cycles, and global events—alongside daily discussions from 190+ Silicon Valley CTOs, CEOs, family offices, and seasoned HNIs.
The enlarged programme goes live Wednesday, September 9. It goes live into a week that also sells $119 billion of new coupon supply: $58 billion of 3 year Tuesday, $39 billion of 10 year Wednesday, $22 billion of 30 year Thursday, and then prints CPI on Friday. Bessent has close to a trillion dollars in the Treasury General Account to work with, and the intent, which is yield curve management by fiscal rather than monetary means, is now explicit.
This is the mechanism we were pointing at. AI capex has crossed over from cash funded to partly debt funded. Every incremental dollar of hyperscaler and neocloud buildout is now priced off this curve. If the long end stays above 5.2%, the marginal AI project gets harder to underwrite regardless of how good the demand is.
Proflex View: The Treasury, not the Fed, is now the marginal buyer of duration, and Wednesday is the first real test of whether $4 billion per operation is enough to matter against $119 billion of supply in the same week. Our expectation is that it is not, on its own. But the direction of travel is unmistakable and it is the single most under-discussed support under this market. Watch the thirty year through Thursday’s auction. That, not the S&P, is where the breakout or breakdown gets decided.
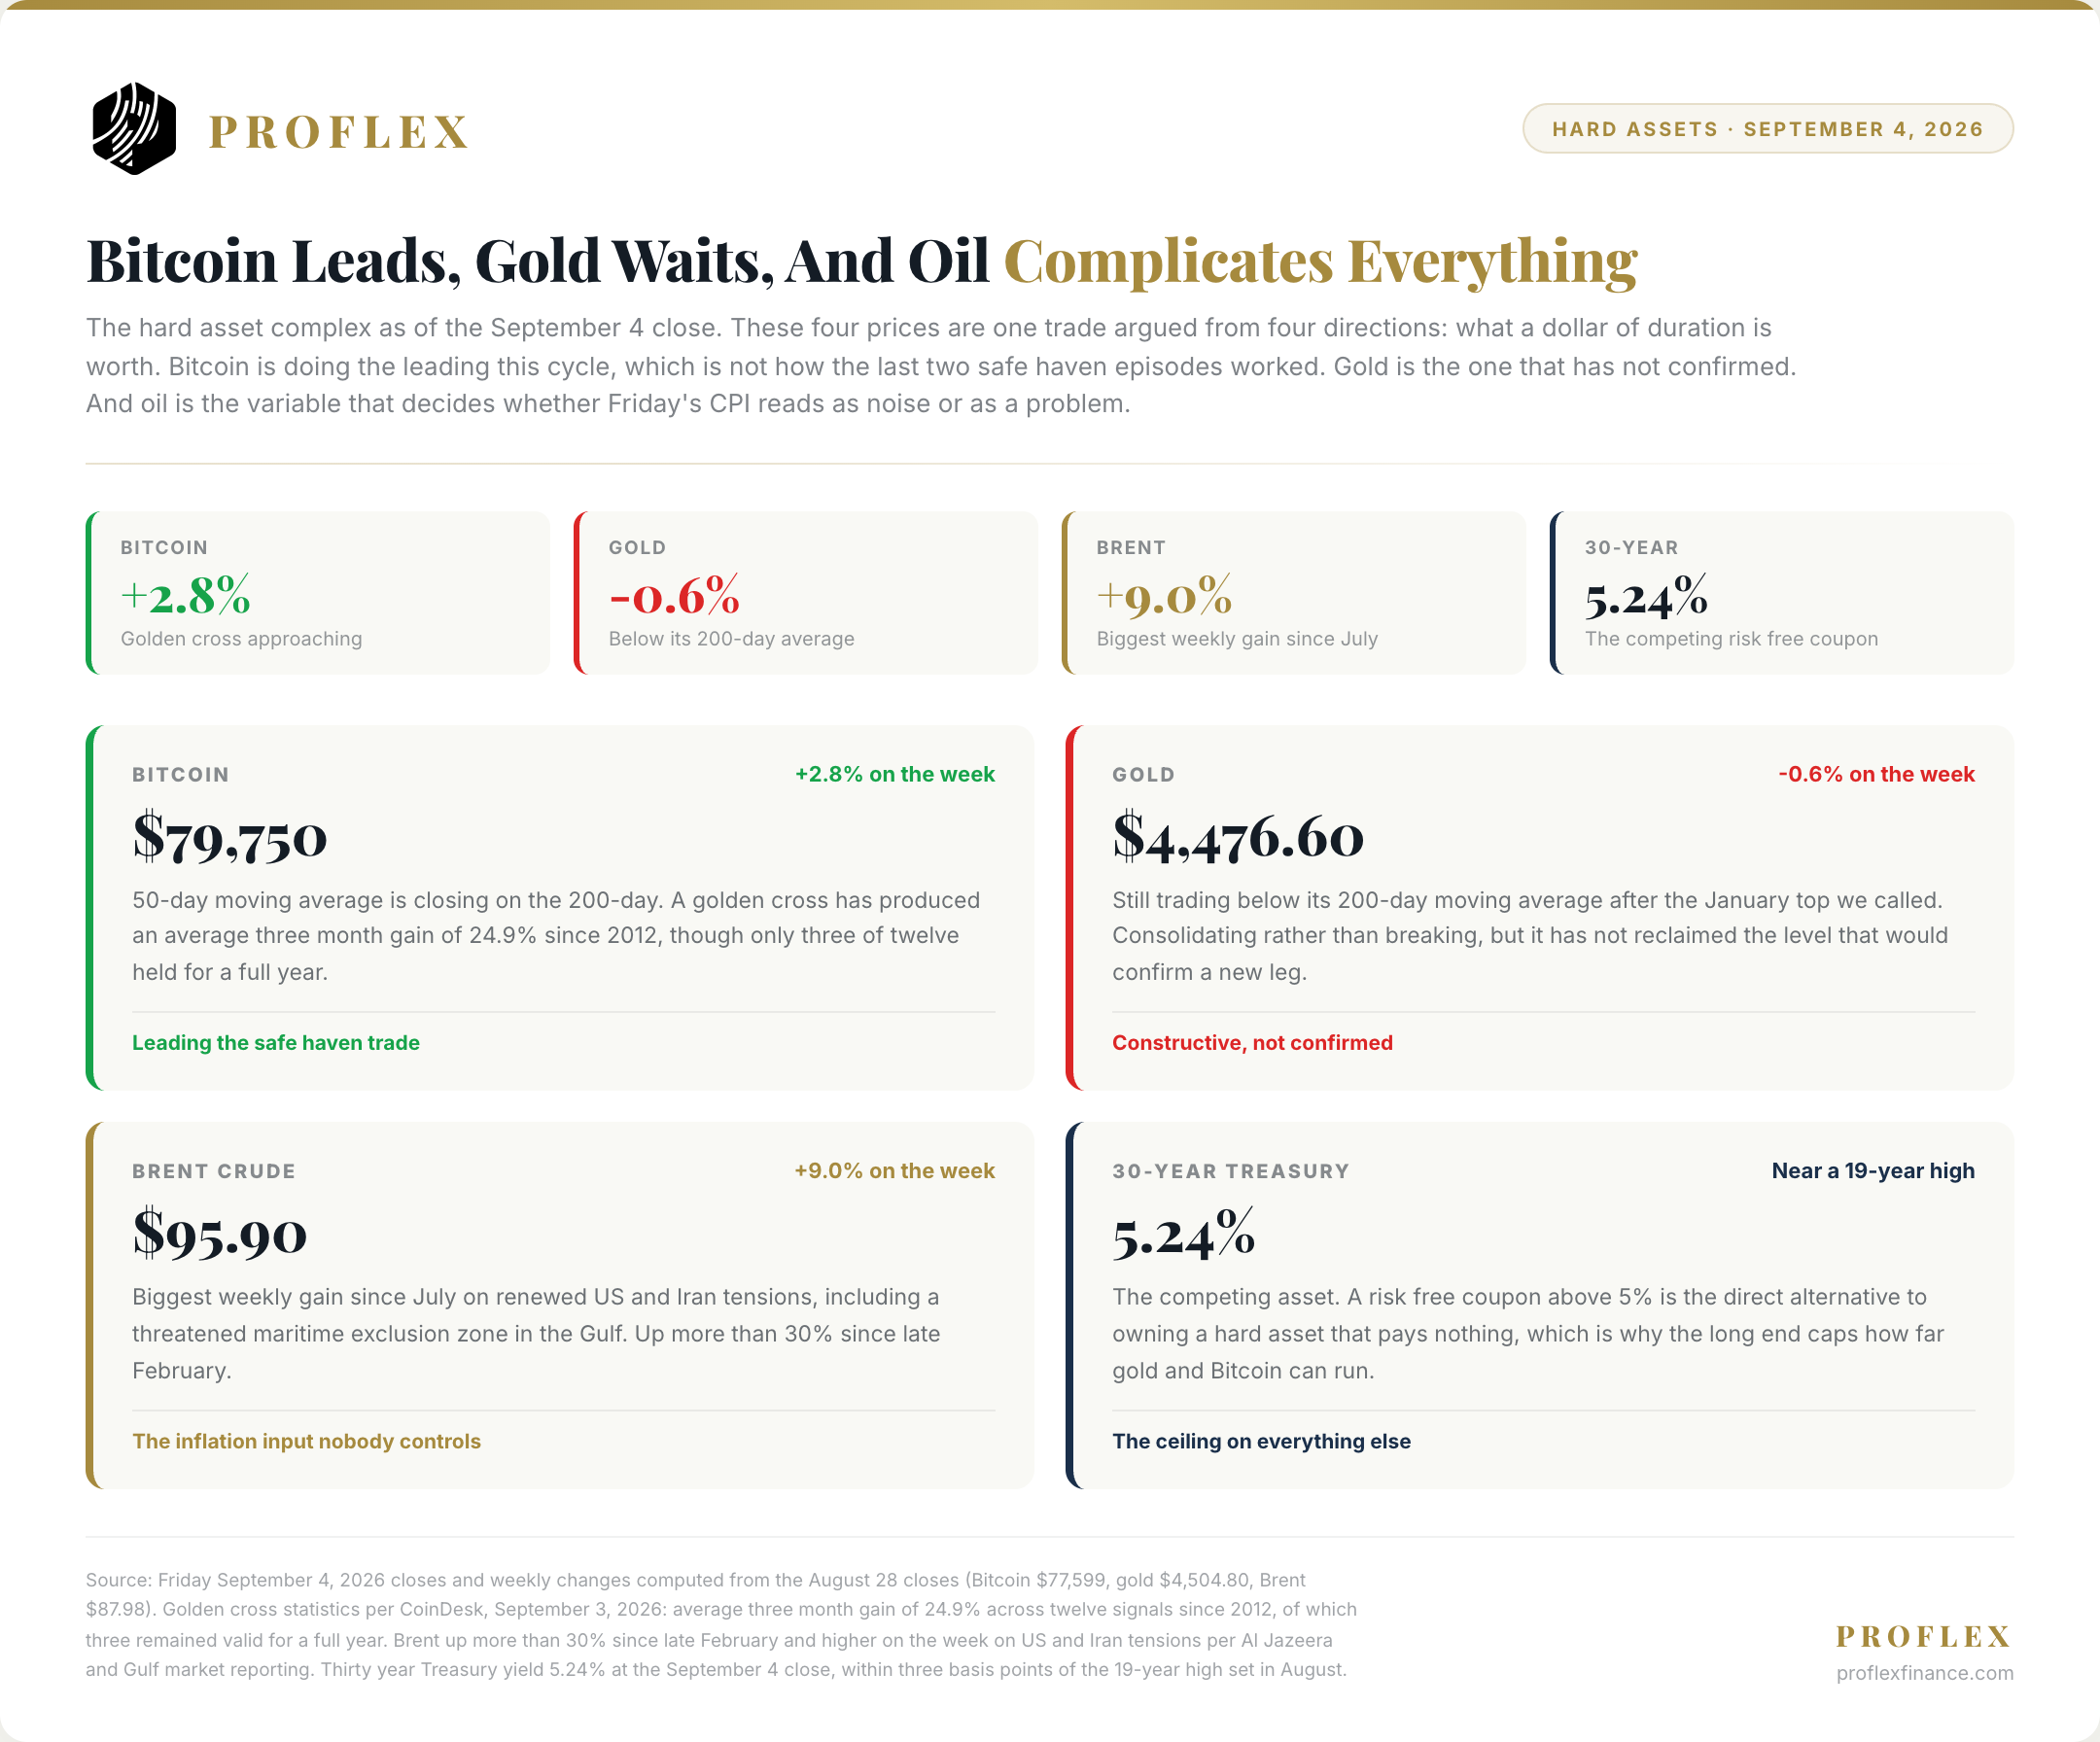
Bitcoin closed the week near $79,750, up 2.8%, with its 50 day average closing on its 200 day. Golden crosses have produced an average three month gain of 24.9% since 2012, though only three of the twelve held for a full year, so treat it as a tailwind rather than a signal. What matters more is what we flagged: the move is consolidating instead of unwinding, and we are a little over a year from the next halving, which is historically when the narrative forms.
Gold went the other way, down 0.6% to $4,476.60, and is still below its 200 day average after the January top we called. Brent did the real moving, +9.0% to $95.90, on Iran threatening a maritime exclusion zone in the Gulf. And sitting against all three is a thirty year Treasury paying 5.24%, which is the direct competition for any asset that yields nothing.
Proflex View: Bitcoin leading gold in a safe haven episode is the genuinely new thing here, and we think it reflects the flow rather than the fundamentals: gold is competing directly with a 5% risk free coupon and Bitcoin is competing with nothing. We stay constructive on both and we are not adding to either until the long end resolves. On oil, we have been flagging for three weeks that Brent grinding higher is the first real evidence against our own view that the Iran tail risk was already priced. It is now $95.90. We are not defending that call, we are marking it.
🔍 What We’re Watching
August CPI at 8:30am Friday, consensus 0.4% month over month against 0.1% prior, with the Fed in blackout
The thirty year yield through Thursday’s $22 billion auction and Wednesday’s first enlarged buyback operation
Oracle Q1 FY2027 Thursday after the close: cloud growth against the 58% to 64% guide, and whether RPO clears half a trillion
Whether the semiconductor complex resolves its triangle up or down before the September 18 roll
Bitcoin, and whether the 50 day average completes the cross above the 200 day
🧭 Proflex Playbook – Respect the Calendar, Not the Narrative Two scheduled events on Wednesday afternoon and Friday morning carry more risk than anything the tape did last week. The liquidity story running underneath them, from the Treasury rather than the Fed, is the one almost nobody is pricing. Our conviction stays anchored in the data:
Focus on Structural Growth: Continue to overweight the secular AI theme, recognizing its multi-year runway.
Anticipate Shallow Corrections: Use dips as accumulation opportunities, not reasons for fear, understanding that "none of the corrections stick."
Diversify Thoughtfully: Recognize the "decorrelation" across asset classes; consider gold, silver and Bitcoin for portfolio resilience.
Develop Mental Models: Prioritize long-term planning (6-12 months out) over short-term news, aiming for consistent, incremental gains.
If you're an All-Access or Managed Portfolio subscriber, our positioning has already shifted ahead of this moment—scaling up asymmetric hard asset plays while hedging for earnings volatility and geopolitical tail risks.
Proflex All-Access: Your Market Compass
Explore the financial markets with Proflex All-Access, your comprehensive resource for deeper market understanding and active participation. This premium service offers subscribers exclusive insights and actionable investment advice, giving you a significant edge in various market conditions.
Proflex All-Access provides detailed analyses and recommendations to optimize your investment strategy. Our specialized newsletters include:
• Growth Gazette (Contains Crypto Pulse) : Aimed at achieving above-market returns for aggressive portfolio growth.
• Income Insider: Focused on conservative strategies and income generation for yield-seeking investors.
Until next week, — The Proflex Team Trusted Macro Insights. Calm Investing. Tactical Trades.
Elevate your financial IQ
ProFlex® by Proflex Finance Legal Disclosures
ProFlex® by Proflex Finance, the premium newsletter product series, provides informational and educational content only and does not offer personalized investment advice or establish a fiduciary relationship. While we rely on reliable sources and research, the information is not tailored to individual financial situations. Readers are urged to consult qualified financial professionals before making investment decisions. We do not guarantee the accuracy, completeness, or timeliness of the information and are not responsible for any investment decisions based on this newsletter. Investing carries risks, and past performance doesn't predict future results. By accessing this newsletter, you acknowledge that we are not liable for actions or decisions resulting from its content. Please conduct due diligence and seek professional advice as needed.
Frequently Asked Questions
The Fed targets 2% inflation measured by the PCE index. When CPI or PCE readings come in above target, the Fed may maintain or raise rates to cool the economy. Below-target readings give the Fed room to cut rates. Markets watch these releases closely because they signal the direction of monetary policy.
Options expiration (especially quarterly "triple witching") can create significant short-term volatility as dealers unwind hedging positions. Gamma exposure determines whether dealer hedging amplifies or dampens moves. Negative gamma environments can accelerate selloffs, while positive gamma tends to suppress volatility. Large open interest strikes often act as price magnets into expiry.
Sector rotation signals include divergence between growth and value indices, relative strength shifts in sector ETFs, credit spread movements, and changes in the yield curve. When defensive sectors outperform cyclicals, it often signals risk-off positioning. Monitoring small-cap (Russell 2000) relative to large-cap performance provides insight into economic confidence and risk appetite.
Oil prices are driven by supply-demand dynamics, OPEC+ production decisions, geopolitical tensions in producing regions, and global economic growth expectations. Rising oil prices increase input costs for businesses, pressure consumer spending, and can signal inflationary pressures that influence central bank policy.
Earnings reports reveal actual business performance versus market expectations. Revenue growth, profit margins, and forward guidance drive stock re-ratings. Beats or misses relative to consensus estimates move individual stocks and can shift sector-wide sentiment. Earnings season also provides insight into broader economic health and consumer spending trends.